- 表が出にくいのではないか(作業仮説)
- 表は 5 回くらいは出そう
- 表が一回以下しか出ないのは 0.011
- 裏が一回以下しか出ないのは 0.011

↓
こんなことは「よく起きること」なのだ

医用統計学入門
統計学の概念とよく使われる手法の解説
検定の考え方 ★
実例


検定の流れ
帰無仮説・対立仮説
数学の「証明」との違い
片側検定と両側検定
検定法の選択
検定統計量
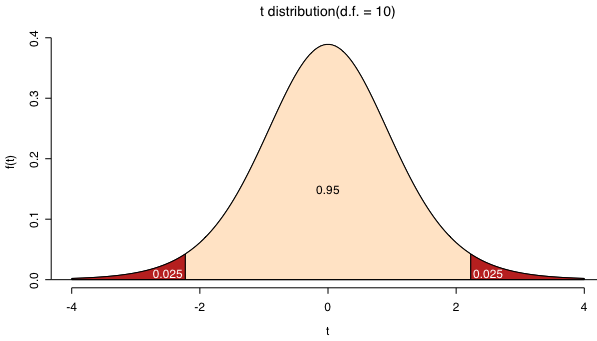
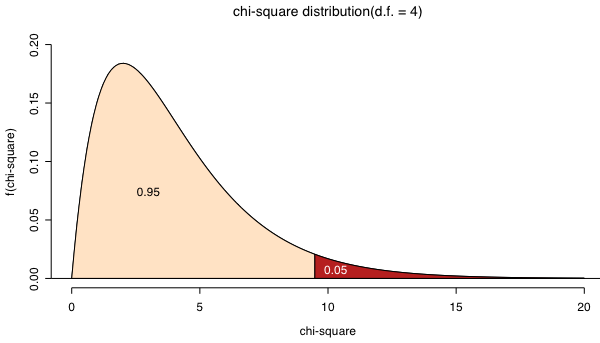
P値(有意確率)
 |  |
第一種の過誤(αエラー)
帰無仮説が正しいときに,帰無仮説が誤りであるとして棄却するという誤り

有意水準の設定
検定による意思決定
第二種の過誤(βエラー)
帰無仮説が誤っているにもかかわらず,帰無仮説を棄却できないという誤り
検出力(1−β)
対立仮説が正しいときに,帰無仮説を棄却して対立仮説を採択できる確率(β=4α 程度が望ましい?)
まとめると
| 検定の結果 | |||
|---|---|---|---|
| 帰無仮説を棄却できない | 帰無仮説を棄却する | ||
| 真実 | 帰無仮説が正しい | 正しい決定 | あわてん坊のエラー α |
| 帰無仮説は誤り | ボンヤリ者のエラー β | 正しい決定 1−β | |
注意すべきこと
検定結果の取り扱い
| 検定の結果 | ||
|---|---|---|
| 統計学的に有意だった | 統計学的に有意でなかった | |
| 実質的な意味がある | 得られた知見を堂々と発表する | もう少しデータを蓄積する データの精度を上げる |
| 実質的な意味がない | 検定は不要だった | 検定は不要だった |
代表的な検定
検定のマニュアル
独立性の検定
カイ二乗検定
> chisq.test(matrix(c(16,12,15,9,12,5,11,2,36,20,24,1),nrow=4))

	Pearson's Chi-squared test

data:  matrix(c(16, 12, 15, 9, 12, 5, 11, 2, 36, 20, 24, 1), nrow = 4)
X-squared = 13.7134, df = 6, p-value = 0.03301

Warning message:
Chi-squared approximation may be incorrect in: chisq.test(matrix(c(16, 12, 15, 9, 12, 5, 11, 2, 36, 20, 24,

> chisq.test(matrix(c(40,10,20,60),nrow=2),correct=FALSE)

	Pearson's Chi-squared test

data:  matrix(c(40, 10, 20, 60), nrow = 2)
X-squared = 37.4524, df = 1, p-value = 9.367e-10
フィッシャーの正確検定
> fisher.test(matrix(c(4,1,2,6),nrow=2))

	Fisher's Exact Test for Count Data

data:  matrix(c(4, 1, 2, 6), nrow = 2)
p-value = 0.1026
alternative hypothesis: true odds ratio is not equal to 1
95 percent confidence interval:
   0.5364938 682.2665965
sample estimates:
odds ratio
   9.47099

> fisher.test(matrix(c(16,12,15,9,12,5,11,2,36,20,24,1),nrow=4))

	Fisher's Exact Test for Count Data

data:  matrix(c(16, 12, 15, 9, 12, 5, 11, 2, 36, 20, 24, 1), nrow = 4)
p-value = 0.03447
alternative hypothesis: two.sided
2 個の代表値の差の検定
代表値とは
対応のあるデータとは
平均値の差の検定
いわゆる t 検定
> my.t.test <- function(n1, x1, u1, n2, x2, u2, welch = FALSE)
+ {
+     method <- paste(if (!welch) "Welch", "Two Sample t-test")
+     if (welch) {
+         df <- n1+n2-2
+         v <- ((n1-1)*u1+(n2-1)*u2)/df
+         tstat <- abs(x1-x2)/sqrt(v*(1/n1+1/n2))
+     }
+     else {
+         tstat <- abs(x1-x2)/sqrt(u1/n1+u2/n2)
+         df <- (u1/n1+u2/n2)^2/((u1/n1)^2/(n1-1)+(u2/n2)^2/(n2-1))
+     }
+     pval <- 2*pt(-tstat, df)
+     result <- c(tstat, df, pval)
+     names(result) <- c("t value", "d. f.", "P value")
+     return(list(method=method, result=result))
+ }
> my.t.test(36, 82.6, 15.3, 43, 84.5, 16.2, welch=TRUE)
$method
[1] "Two Sample t-test"

$result
    t value       d. f.     P value
 2.11651800 77.00000000  0.03753134

> my.t.test(36, 82.6, 15.3, 43, 84.5, 16.2, welch=FALSE)
$method
[1] "Welch Two Sample t-test"

$result
    t value       d. f.     P value
 2.12195266 75.26729060  0.03713237
> first <- c(7,11,10,10,13,10,9,8,11,12,6,13,11,8,11)
> second <- c(4,9,7,6,10,12,10,5,12,10,5,10,15,9,9)
> t.test(first, second, paired=TRUE)

	Paired t-test

data:  first and second
t = 1.8628, df = 14, p-value = 0.0836
alternative hypothesis: true difference in means is not equal to 0
95 percent confidence interval:
 -0.1715693  2.4382360
sample estimates:
mean of the differences
               1.133333
代表値の差の検定
> gr1 <- c(78,64,75,45,82)
> gr2 <- c(110,70,53,51)
> wilcox.test(gr1, gr2)

	Wilcoxon rank sum test

data:  gr1 and gr2
W = 11, p-value = 0.9048
alternative hypothesis: true mu is not equal to 0
> x <- c(269,230,365,282,295,212,346,207,308,257)
> y <- c(273,213,383,282,297,213,351,208,294,238)
> wilcox.test(x, y, paired=TRUE,correct=FALSE)

	Wilcoxon signed rank test

data:  x and y
V = 22, p-value = 0.9527
alternative hypothesis: true mu is not equal to 0

Warning messages:
1: Cannot compute exact p-value with ties in: wilcox.test.default(x, y, paired = TRUE, correct = FALSE)
2: Cannot compute exact p-value with zeroes in: wilcox.test.default(x, y, paired = TRUE, correct = FALSE)
生存率解析
方法
> group <- c(1, 1, 2, 2, 1, 1, 2, 2, 1, 2, 2, 1, 1, 1, 2, 2, 2, 1, 1, 2, 1, 2, 1, 2, 1, 2, 2, 1, 1, 1)
> event <- c(1, 0, 1, 1, 0, 0, 1, 0, 0, 0, 1, 1, 0, 0, 0, 1, 0, 0, 1, 1, 0, 1, 0, 0, 1, 0, 1, 0, 0, 0)
> time <- c(2, 20, 5, 1, 3, 17, 2, 3, 15, 14, 12, 13, 11, 11, 10, 8, 8, 3, 7, 3, 6, 2, 5, 4, 2, 3, 1, 3, 2, 1)
> a.group <- group == 1
> km.surv(time[a.group], event[a.group])
       i time truncate         p         P         SE
 [1,]  1    1        1 1.0000000 1.0000000         NA
 [2,]  2    2        0 0.9333333 0.9333333 0.06440612
 [3,]  3    2        0 0.9285714 0.8666667 0.08777075
 [4,]  4    2        1 1.0000000 0.8666667         NA
 [5,]  5    3        1 1.0000000 0.8666667         NA
 [6,]  6    3        1 1.0000000 0.8666667         NA
 [7,]  7    3        1 1.0000000 0.8666667         NA
 [8,]  8    5        1 1.0000000 0.8666667         NA
 [9,]  9    6        1 1.0000000 0.8666667         NA
[10,] 10    7        0 0.8571429 0.7428571 0.13710884
[11,] 11   11        1 1.0000000 0.7428571         NA
[12,] 12   11        1 1.0000000 0.7428571         NA
[13,] 13   13        0 0.7500000 0.5571429 0.19089707
[14,] 14   15        1 1.0000000 0.5571429         NA
[15,] 15   17        1 1.0000000 0.5571429         NA
[16,] 16   20        1 1.0000000 0.5571429         NA
> library(survival)
> dat <- Surv(time[a.group], event[a.group])
> res <- survfit(dat)
> res
Call: survfit(formula = dat)

        n    events     rmean se(rmean)    median   0.95LCL   0.95UCL
    16.00      4.00     14.69      2.14       Inf     13.00       Inf
> summary(res)
Call: survfit(formula = dat)

 time n.risk n.event survival std.err lower 95% CI upper 95% CI
    2     15       2    0.867  0.0878        0.711            1
    7      7       1    0.743  0.1371        0.517            1
   13      4       1    0.557  0.1909        0.285            1
> plot(res)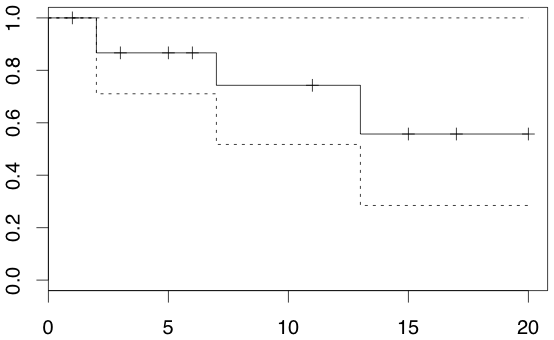
生存率の検定
Cox の比例ハザードモデル ★
時間に関係なく,二群のハザード比(瞬間死亡率の比)が一定であると仮定したモデル
上の結果の解釈> library(eha) > dat <- data.frame(time = c(4, 3, 1, 1, 2, 2, 3), status = c(1, 1, 1, 0, 1, 1, 0), x = c(0, 2, 1, 1, 1, 0, 0), sex = c(0, 0, 0, 0, 1, 1, 1)) > coxreg(Surv(time, status) ~ x + strata(sex), data = dat) Call: coxreg(formula = Surv(time, status) ~ x + strata(sex), data = dat) Covariate Mean Coef Rel.Risk L-R p Wald p x 0.625 0.802 2.231 0.329 Events 5 Total time at risk 16 Max. log. likelihood -3.3277 LR test statistic 1.09 Degrees of freedom 1 Overall p-value 0.297117
クラスター分析 ★
クラスター分析の手順
クラスター分析の手法
| ウォード法 | 最も明確なクラスターを作る |
| 最近隣法 | 分類感度は低い |
| 最遠隣法 | 分類感度は高い |
| メディアン法 | 最近隣法と最遠隣法の折衷 |
| メディアン法 重心法 | 距離の逆転が生じることがある |
| 可変法 | パラメータの設定による |
> data <- matrix(c(
+ 10.2, 6.3,
+ 1.7, 7.8,
+ 0.6, 0.1,
+ 3.0, 2.5,
+ 2.1, 0.0,
+ 7.7, 2.2,
+ 3.2, 8.6,
+ 4.9, 7.2,
+ 9.1, 0.6,
+ 6.7, 0.8,
+ 9.9, 5.9,
+ 3.8, 0.9,
+ 5.5, 6.0,
+ 2.6, 1.0,
+ 2.0, 4.0
+ ), byrow=TRUE, nc=2)
> plot(data)
> text(data, offset=0.2,pos=4)
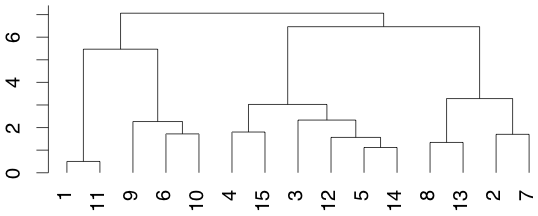
> plot(hclust(dist(data), "average"), hang=-1)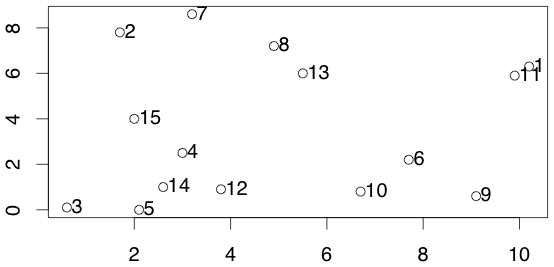
k-means 法
> library(mva)
Warning message:
package 'mva' has been merged into 'stats' (R.1.9.0 から)
> x <- matrix(c(
+      -0.639, -0.242,
+       1.320,  0.519,
+       0.775, -1.996,
+       0.126,  0.728,
+       1.117,  1.576,
+      -1.809,  0.595,
+      -0.016, -0.871,
+      -0.319, -0.280,
+      -1.438,  0.583,
+      -0.233,  0.905
+      ), byrow=TRUE, ncol=2)
> result <- kmeans(x, 3)
> result
$cluster
 [1] 3 1 3 1 1 2 3 3 2 1

$centers
      [,1]     [,2]
1  0.58250  0.93200
2 -1.62350  0.58900
3 -0.04975 -0.84725

$withinss
[1] 2.3306790 0.0688925 3.1093535

$size
[1] 4 2 4

> plot(x, xlim=c(-2,2), ylim=c(-2,2))
> text(x[,1], x[,2], result$cluster, pos=4, offset=0.5)
URL など