三群の平均値(代表値)の差を検定するとき
First upload: Feb 10, 2007
以下のシミュレーション結果の解釈においては,まず,二群の平均値(代表値)の差を検定するときをご覧ください。
シミュレーションプログラムのソース
===== begin =====
BF.sim <- function(type, n1=20, n2=20, n3=20, sd1=1, sd2=1, sd3=1, loop)
{
        calc <- function(x1, x2, x3, n1, n2, n3)
        {
                # median test                                     メディアン検定
                dt <- c(x1, x2, x3)
                md <- median(dt)
                r1 <- sum(x1 < md)
                r2 <- sum(x2 < md)
                r3 <- sum(x3 < md)
                tbl <- matrix(c(r1, r2, r3, n1-r1, n2-r2, n3-r3), 3, 2)
                chisq <- chisq.test(tbl)$p.value
                g <- factor(rep(1:3, c(n1, n2, n3)))
                kruskal <- kruskal.test(dt~g)$p.value
                oneway.w <- oneway.test(dt~g, var.equal=FALSE)$p.value
                oneway <- oneway.test(dt~g, var.equal=TRUE)$p.value
                return(c(
                        chisq=chisq,                            # 1 メディアン検定を カイ二乗検定で
                        kruskal=kruskal,                        # 2 クラスカル・ウォリス検定
                        oneway=oneway,                          # 3 一元配置分散分析
                        oneway.w=oneway.w                       # 4 ウエルチの方法による一元配置分散分析
                        ))
        }
        if (type == "normal") {                                 # 正規分布
                g1 <- matrix(rnorm(n1*loop, sd=sd1), loop, n1)
                g2 <- matrix(rnorm(n2*loop, sd=sd2), loop, n2)
                g3 <- matrix(rnorm(n3*loop, sd=sd3), loop, n3)
        }
        else if (type == "lognormal") {                         # 対数正規分布みたいな外形をした分布(平均値,標準偏差を調整する)
                g1 <- matrix(scale(rlnorm(n1*loop, sdlog=0.4)), loop, n1)
                g2 <- matrix(scale(rlnorm(n2*loop, sdlog=0.4))*sd2, loop, n2)
                g3 <- matrix(scale(rlnorm(n3*loop, sdlog=0.4))*sd3, loop, n3)
        }
        else if (type == "uniform") {                           # 一様分布
                g1 <- matrix(scale(runif(n1*loop)), loop, n1)
                g2 <- matrix(scale(runif(n2*loop))*sd2, loop, n2)
                g3 <- matrix(scale(runif(n3*loop))*sd3, loop, n3)
        }
        result <- t(sapply(1:loop, function(i) calc(g1[i,], g2[i,], g3[i,], n1, n2, n3)))
        return(result)
}
draw <- function(type, n1, n2, n3, result, loop)
{
        color <- c("", "red","blue","purple","brown")
        linetype <- c(4,1,2,3,1)
        rng <- range(as.vector(result[,2:5]))
        pdf(paste(type, n1, n2, n3, "pdf", sep="."), onefile=FALSE, width=800/72, height=600/72)
        old <- par(mar=c(4,4,1,1), cex=2)
        plot(c(1,16), rng, type="n", ylim=c(0, 0.25), xaxt="n", xlab="sd2 / sd1", ylab="Type I error",
                main=paste(type, ", n1=", n1, ", n2=", n2, ", n3=", n3, ", loop=", loop, sep=""))
        sapply(2:5, function(i) lines(1:16, result[,i], col=color[i], lwd=4, lty=linetype[i]))
        abline(h=0.05, v=16, lty=3, lwd=1)
        legend(1, 0.25, c("chisq.test", "kruskal.test", "oneway.test", "oneway.test(w)"), col=color[2:5], lwd=6)
        axis(1, at=1:16, labels=c("1", "1.2", "1.4", "1.6", "1.8", "2", "2.2", "2.4", "2.6", "2.8", "3", "3.2", "3.4", "3.6", "3.8", "4"))
        par(old)
        dev.off()
}
driver2 <- function(type, n1, n2, n3, sd2, loop)
{
        result <- BF.sim(type, n1=n1, n2=n2, n3=n3, sd1=1, sd2=sd2, sd3=1/sd2, loop)
        resultp <- result < 0.05
        return(colSums(resultp)/loop)
}
driver <- function(type, n1, n2, n3, sd2, loop)
{
        sink(paste(type, n1, n2, n3, "log", sep="."))
        cat("\n\nn1=", n1, "   n2=", n2, "   n3=", n3, "   trial=", loop, "   distribution=", type, "\n\n")
        result <- t(sapply(sd2, function(sd2) c(sd2=sd2, driver2(type, n1, n2, n3, sd2, loop))))
        print(result)
        draw(type, n1, n2, n3, result, loop)
        sink()
}
# 第二群の標準偏差のベクトル 1〜4 を 0.2 刻みで,逆方向も
sd2 <- seq(1, 4, by=0.2)                        # 大きくなる方
loop <- 5000
driver("normal", 20, 20, 20, sd2, loop)         # 分布の形,3群のサンプルサイズ,試行回数
=====end =====
結論:
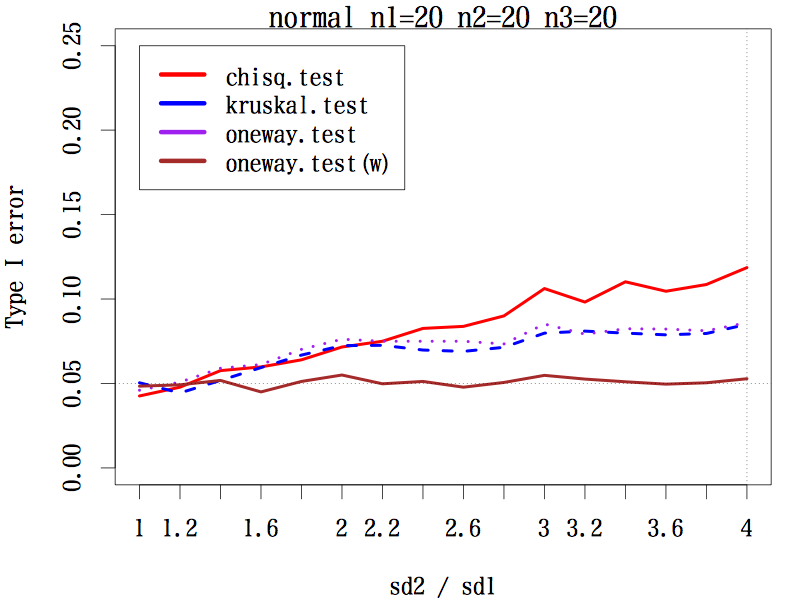
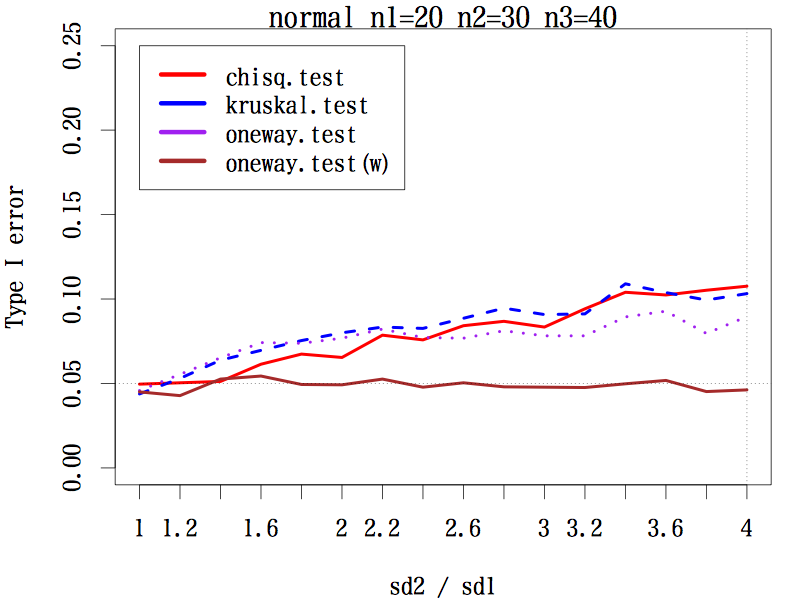
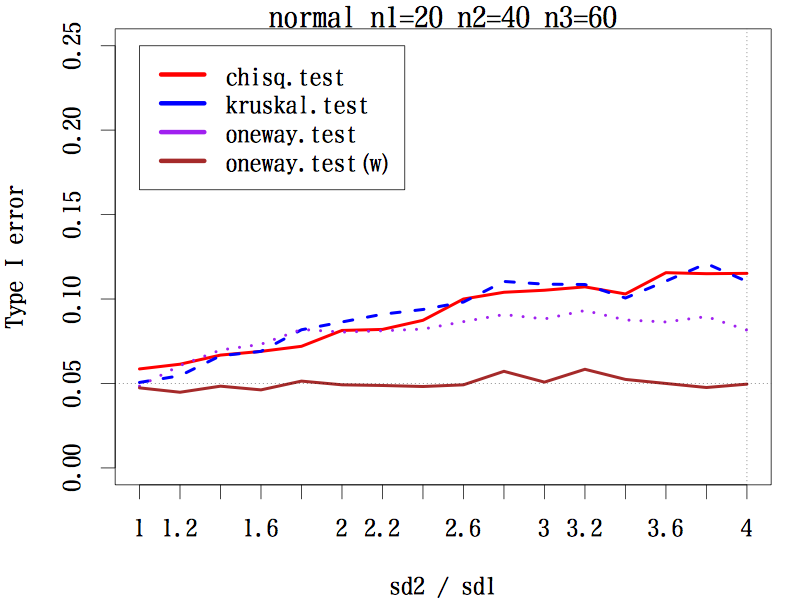
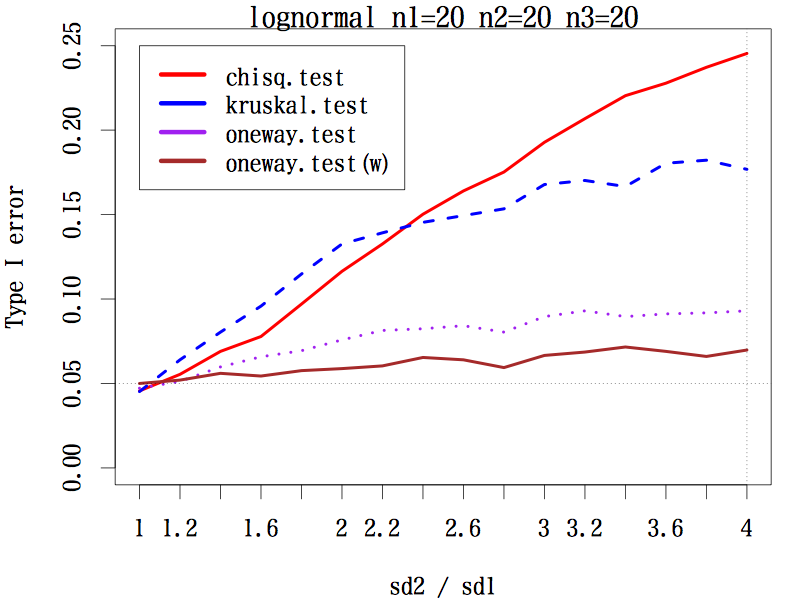
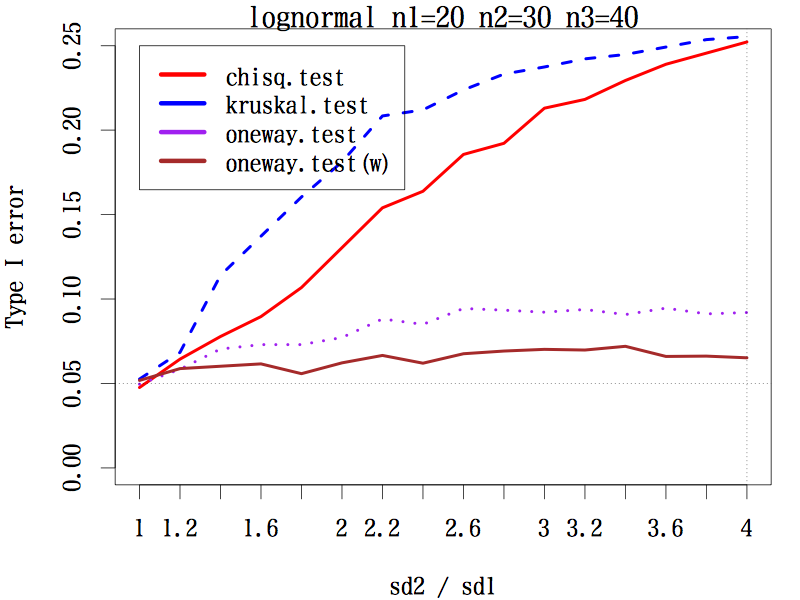
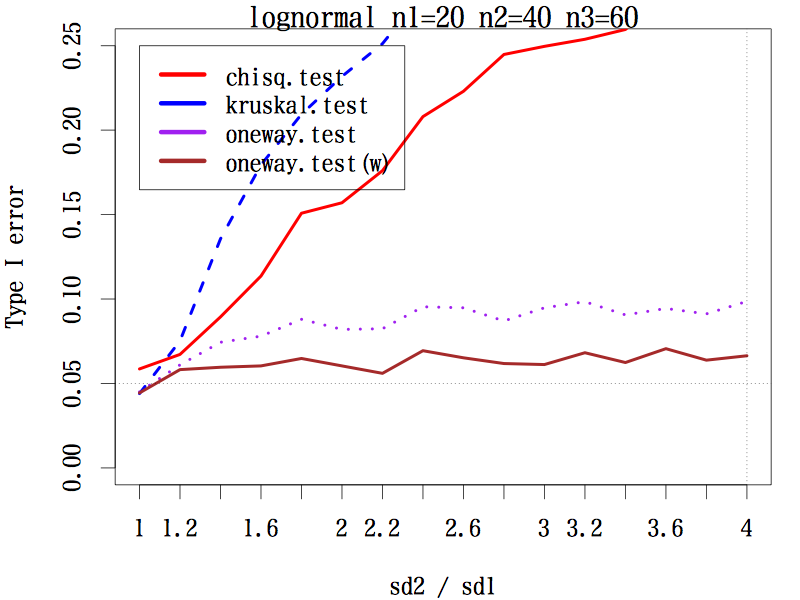
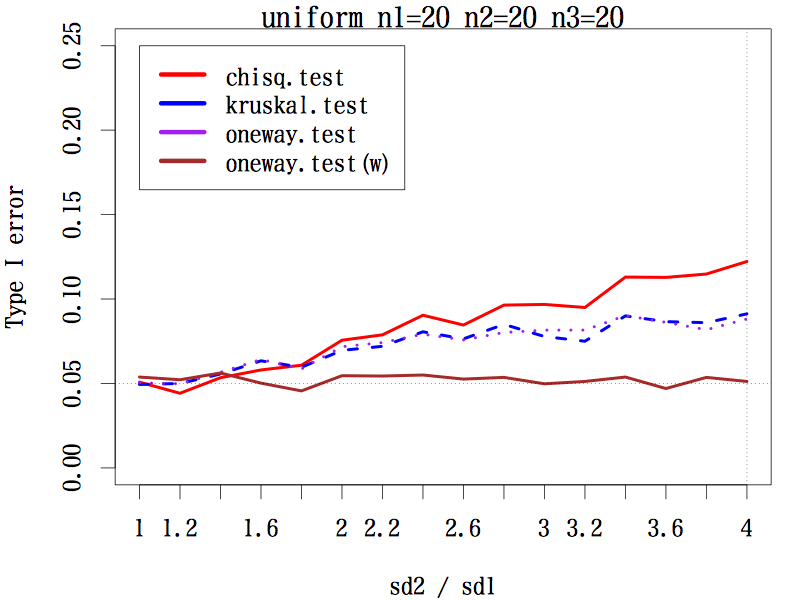
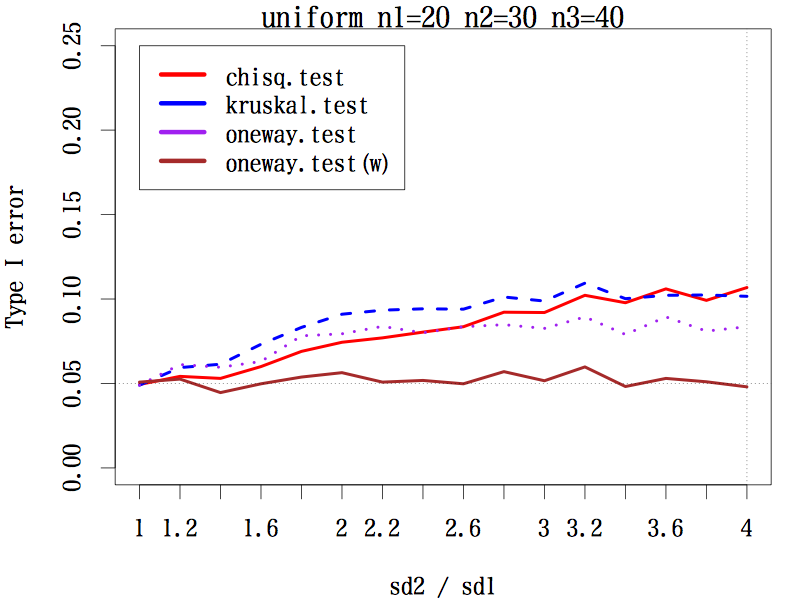
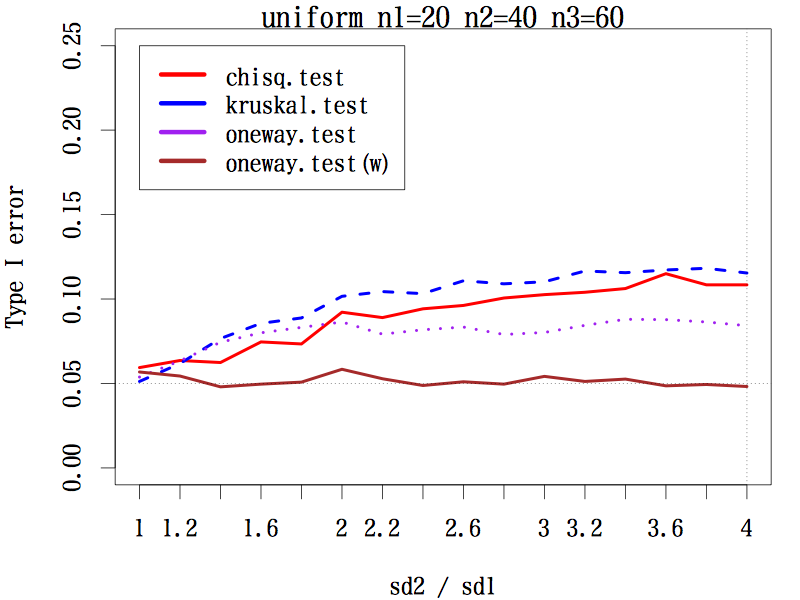
3 群の場合で,サンプルサイズが(20, 20, 20), (20, 30, 40), (20, 40, 60) の 3 通り,分布は本文中のように 3 種類,標準偏差の比を,第二群は 1 〜 4 まで 0.2 刻み,第三群は 1 〜 1/4 まで分母を 0.2 刻みでシミュレーションした。検定は,中央値検定,クラスカル・ウォリス検定,一元配置分散分析,等分散性を仮定しない一元配置分散分析である。
その結果,あらゆる条件の下で等分散性を仮定しない一元配置分散分析の第一種の過誤はほぼ 0.05 をキープしている(参考図)。
結論としては,母分散の異なる(可能性のある)3 群以上の平均値の差には,予備検定なしで等分散性を仮定しない一元配置分散分析を行うことが推奨される。
左右対称な分布の場合
歪んだ分布の場合
一様な分布の場合
ご意見・ご希望,間違いの指摘等がありましたら,
下記宛へ E-mail いただくと,たいへんうれしく思います。
 E-mail to Shigenobu AOKI
