チャーノフの顔グラフ Last modified: Apr 13, 2004
目的
チャーノフの顔グラフを描く
使用法
face.plot(x, size=480)
引数
x 18 個の要素を持つベクトル
データベクトルからこのベクトルを用意するために,face.data という関数を使うとよい
size 顔の大きさ
ソース
インストールは,以下の 1 行をコピーし,R コンソールにペーストする
source("http://aoki2.si.gunma-u.ac.jp/R/src/face_plot.R", encoding="euc-jp")
# チャーノフの顔グラフ
face.plot <- function(x, size=480)
{
# 円弧を描く
arc1 <- function(x1, y1, r, l)
{
sign <- ifelse(l > 0, -1, 1)
theta <- sign*acos(x1/r)
y1 <- y1-sign*sqrt(r^2-x1^2)
if (l <= 0) {
arc(0, y1, r, theta, pi-theta)
}
else {
arc(0, y1, r, pi-theta, pi*2+theta)
}
}
# 円(の一部)を描く
arc <- function(ox, oy, r, theta.start, theta.end)
{
step <- min(0.1, (theta.end-theta.start)*0.1)
interval <- c(seq(theta.start, theta.end, step), theta.end)
lines(r*cos(interval)+ox, r*sin(interval)+oy)
}
# 楕円(の一部)を描く
ellipse <- function(ox, oy, r.a, r.b, theta.axis, theta.start, theta.end)
{
theta.end <- theta.end+(theta.end <= theta.start)*pi*2
temp1 <- r.a*r.b
temp2 <- 30/(r.a+r.b)
k <- (theta.end-theta.start)/temp2+2
x <- y <- numeric(k)
for (i in 1:(k-1)) {
factor <- temp1/sqrt((r.a*sin(theta.start))^2+(r.b*cos(theta.start))^2)
x[i] <- factor*cos(theta.axis+theta.start)
y[i] <- factor*sin(theta.axis+theta.start)
theta.start <- theta.start+temp2
}
factor <- temp1/sqrt((r.a*sin(theta.end))^2+(r.b*cos(theta.end))^2)
x[k] <- factor*cos(theta.axis+theta.end)
y[k] <- factor*sin(theta.axis+theta.end)
lines(ox+x, oy+y)
}
pi2 <- 2*pi
plot(c(-500, 500), c(-500, 500), type="n", xlab="", xaxt="n", ylab="", yaxt="n", bty="n")
size2 <- size*(1+x[1])/2
theta <- (pi/4)*(2*x[2]-1)
h <- size*(1+x[3])/2
x1 <- size2*cos(theta)
y1 <- size2*sin(theta)
# 顔の上半分
ak <- 1-x[4]^2
oy1 <- (ak*x1^2+y1^2-h^2)/(2*(y1-h))
r.b1 <- h-oy1
r.a1 <- r.b1/sqrt(ak)
theta.start <- atan((y1-oy1)/x1)
theta.end <- pi-theta.start
ellipse(0, oy1, r.a1, r.b1, 0, theta.start, theta.end)
# 顔の下半分
ak <- 1-x[5]^2
oy2 <- (ak*x1^2+y1^2-h^2)/(2*(y1+h))
r.b2 <- h+oy2
r.a2 <- r.b2/sqrt(ak)
theta.end <- atan((y1-oy2)/x1)
theta.start <- pi-theta.end
ellipse(0, oy2, r.a2, r.b2, 0, theta.start, theta.end)
# 鼻
y <- h*x[6]
lines(c(0, 0), c(y, -y))
# 口
pm <- -h*(x[7]+(1-x[7])*x[6])
wm <- sqrt(r.a2^2*(1-(pm-oy2)^2/r.b2^2))
if (x[8] == 0) {
lines(c(-wm/2, wm/2), c(pm, pm))
}
else {
r <- h/abs(x[8])
am <- x[9]*r
x1 <- ifelse(am > wm, x[9]*wm, am)
l <- ifelse(x[8] <= 0, -1, 1)
y1 <- pm-l*(r-sqrt(r^2-x1^2))
arc1(x1, y1, r, l)
}
# 目
ye <- h*(x[10]+(1-x[10])*x[6])
we <- sqrt(r.a1^2*(1-(ye-oy1)^2/r.b1^2))
xe <- we*(1+2*x[11])/4
theta <- (2*x[12]-1)*pi/5
r.a3 <- x[14]*min(xe, we-xe)
r.b3 <- sqrt(r.a3^2*(1-x[13]^2))
ellipse(xe, ye, r.a3, r.b3, theta, 0, pi2)
ellipse(-xe, ye, r.a3, r.b3, pi-theta, 0, pi2)
# 瞳
re <- r.a3/sqrt(cos(theta)^2+sin(theta)^2/x[13]^2)
shift <- re*(2*x[15]-1)
sapply(c(xe, -xe)-shift, function(arg) arc(arg, ye, 3, 0, pi2))
# 眉
theta2 <- 2*(1-x[17])*(pi/5)
theta3 <- ifelse(theta >= 0, theta+theta2, theta-theta2)
len <- re*(2*x[18]+1)/2
x0 <- len*cos(theta3)
x1 <- xe-c(x0, -x0)
y0 <- len*sin(theta3)
y1 <- ye+2*(x[16]+0.3)*r.a3*x[13]-c(y0, -y0)
lines(x1-shift, y1)
lines(-x1-shift, y1)
}
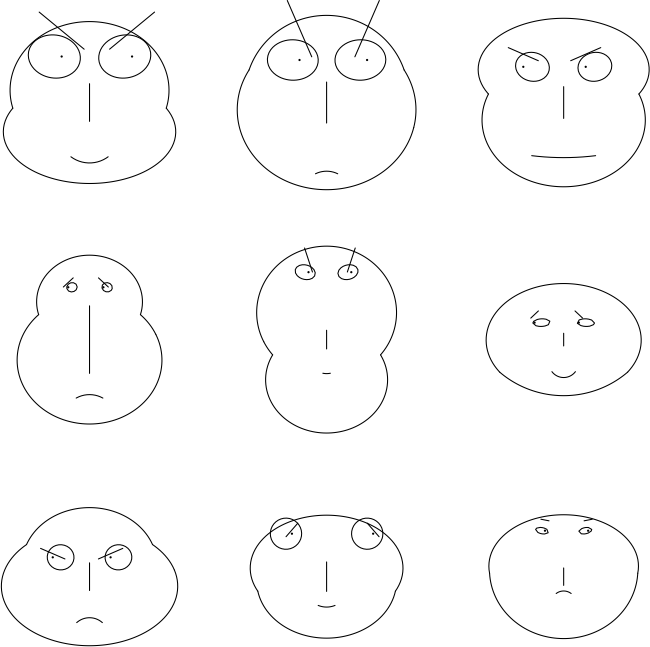
使用例
> nv <- 18
> d <- matrix(rnorm(9*nv), ncol=nv)
> x <- face.data(d)
> old <- par(mar=c(1,1,1,1), mfrow=c(3, 3)) # 図を3行3列に描く
> for(i in 1:9) {
+ face.plot(x[i,])
+ }
> par(old) # パラメータを元に戻す
出力結果例
 解説ページ
脇本和昌,垂水共之,田中豊編「パソコン統計解析ハンドブック I 基礎統計編」共立出版株式会社株式会社
解説ページ
脇本和昌,垂水共之,田中豊編「パソコン統計解析ハンドブック I 基礎統計編」共立出版株式会社株式会社
直前のページへ戻る E-mail to Shigenobu AOKI
