No.05609 Re: べき乗回帰曲線 【青木繁伸】 2008/01/30(Wed) 18:43
Excel ではとても,やりきれんので R を勉強した方が,結局「急がば回れ」と言うことになると思います。
> x <- 0:5 # テストデータ必要なのは nls と confint だけです(とはいっても,R のインストールと操作一般は必要ですが)
> y <- c(0, 0.62, 1.03, 1.4, 1.73, 2.04) # テストデータ
> df <- data.frame(x=x, y=y) # データフレームにしておく
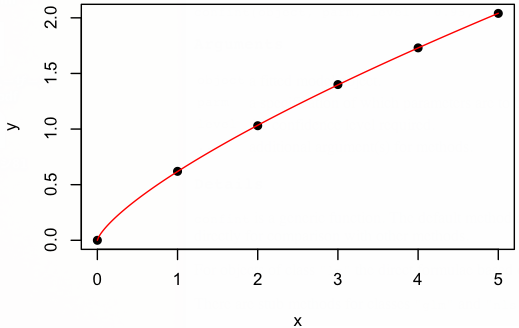
> plot(x, y, pch=19) # データ点をプロット
> ans <- nls(y ~ a*x^b, data=df, start=list(a=1, b=1)) # 非線形回帰
> summary(ans) # パラメータなどの表示
Formula: y ~ a * x^b
Parameters:
Estimate Std. Error t value Pr(>|t|)
a 0.618362 0.001829 338.1 4.59e-10 ***
b 0.741903 0.002182 340.0 4.49e-10 ***
---
Signif. codes: 0 ‘***’ 0.001 ‘**’ 0.01 ‘*’ 0.05 ‘.’ 0.1 ‘ ’ 1
Residual standard error: 0.002708 on 4 degrees of freedom
Number of iterations to convergence: 4
Achieved convergence tolerance: 3.046e-06
> confint(ans, c("a", "b")) # パラメータの95%信頼限界
Waiting for profiling to be done...
2.5% 97.5%
a 0.6132908 0.6234485
b 0.7358561 0.7479735
> x2 <- seq(0, 5, length.out=300) # 推定された曲線を描くために細かな区切り
> df2 <- data.frame(x=x2) # データフレームにする
> y2 <- predict(ans, newdata=df2) # 推定値を計算
> lines(x2, y2, col="red") # 曲線表示
