No.04951 Re: AICでモデルを検討したいのですが 【青木繁伸】 2007/12/06(Thu) 20:24
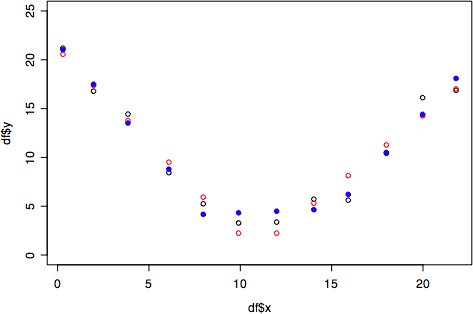
示されたデータで何を何で予測するのかよくわからなかったので,別の例を作ってやってみました。データを折れ線で回帰するとき,2本の折れ線と3本の折れ線どっちが良いかというもの。注釈なしで(間違えているかも知れないけど)
> df <- structure(list(x = c(0.292, 1.97, 3.853, 6.091, 7.973, 9.906,白丸が実測値。赤丸が2本の折れ線で回帰(model1),青丸が3本の折れ線で回帰(model2)。
11.992, 14.027, 15.909, 17.995, 19.979, 21.81), y = c(21.189,
16.783, 14.44, 8.44, 5.253, 3.284, 3.378, 5.722, 5.628, 10.503,
16.127, 16.877), model1 = structure(c(1L, 1L, 1L, 1L, 1L, 1L,
2L, 2L, 2L, 2L, 2L, 2L), .Label = c("part1", "part2"), class = "factor"),
model2 = structure(c(1L, 1L, 1L, 1L, 2L, 2L, 2L, 2L, 3L,
3L, 3L, 3L), .Label = c("part1", "part2", "part3"), class = "factor")),
.Names = c("x", "y", "model1", "model2"),
row.names = c(NA, -12L), class = "data.frame")
> df
x y model1 model2
1 0.292 21.189 part1 part1
2 1.970 16.783 part1 part1
3 3.853 14.440 part1 part1
4 6.091 8.440 part1 part1
5 7.973 5.253 part1 part2
6 9.906 3.284 part1 part2
7 11.992 3.378 part2 part2
8 14.027 5.722 part2 part2
9 15.909 5.628 part2 part3
10 17.995 10.503 part2 part3
11 19.979 16.127 part2 part3
12 21.810 16.877 part2 part3
> lm.model1 <- lm(y~model1*x, df)
> plot(df$y~df$x, ylim=c(0,25))
> points(lm.model1$fitted.values~df$x, col=2)
> lm.model2 <- lm(y~model2*x, df)
> points(lm.model2$fitted.values~df$x, col=4, pch=19)
> summary(lm.model1)
Call:
lm(formula = y ~ model1 * x, data = df)
Residuals:
Min 1Q Median 3Q Max
-2.5094 -0.6978 0.1403 0.7571 1.8694
Coefficients:
Estimate Std. Error t value Pr(>|t|)
(Intercept) 21.1202 1.0330 20.45 3.43e-08 ***
model1part2 -36.9056 3.1118 -11.86 2.34e-06 ***
x -1.9057 0.1715 -11.11 3.85e-06 ***
model1part2:x 3.4094 0.2414 14.12 6.14e-07 ***
---
Signif. codes: 0 ‘***’ 0.001 ‘**’ 0.01 ‘*’ 0.05 ‘.’ 0.1 ‘ ’ 1
Residual standard error: 1.401 on 8 degrees of freedom
Multiple R-Squared: 0.9628, Adjusted R-squared: 0.9489
F-statistic: 69.04 on 3 and 8 DF, p-value: 4.637e-06
> AIC(lm.model1)
[1] 47.28954
> summary(lm.model2)
Call:
lm(formula = y ~ model2 * x, data = df)
Residuals:
Min 1Q Median 3Q Max
-1.2162 -0.7945 -0.1353 0.9566 1.7186
Coefficients:
Estimate Std. Error t value Pr(>|t|)
(Intercept) 21.6534 1.1678 18.542 1.59e-06 ***
model2part2 -18.1154 3.5378 -5.120 0.002177 **
model2part3 -47.4519 5.9533 -7.971 0.000208 ***
x -2.1106 0.3124 -6.757 0.000513 ***
model2part2:x 2.1900 0.4317 5.073 0.002282 **
model2part3:x 4.1230 0.4376 9.423 8.12e-05 ***
---
Signif. codes: 0 ‘***’ 0.001 ‘**’ 0.01 ‘*’ 0.05 ‘.’ 0.1 ‘ ’ 1
Residual standard error: 1.349 on 6 degrees of freedom
Multiple R-Squared: 0.9741, Adjusted R-squared: 0.9526
F-statistic: 45.2 on 5 and 6 DF, p-value: 0.0001102
> AIC(lm.model2)
[1] 46.93006
> anova(lm.model1, lm.model2)
Analysis of Variance Table
Model 1: y ~ model1 * x
Model 2: y ~ model2 * x
Res.Df RSS Df Sum of Sq F Pr(>F)
1 8 15.7130
2 6 10.9266 2 4.7864 1.3142 0.3363
