例題:
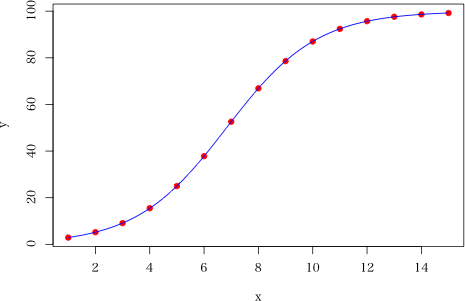
「表 1 に示すようなデータに曲線をあてはめなさい。」
| x | 1 | 2 | 3 | 4 | 5 | 6 | 7 | 8 | 9 | 10 | 11 | 12 | 13 | 14 | 15 |
|---|---|---|---|---|---|---|---|---|---|---|---|---|---|---|---|
| y | 2.9 | 5.2 | 9.1 | 15.5 | 25 | 37.8 | 52.6 | 66.9 | 78.6 | 87 | 92.4 | 95.7 | 97.6 | 98.6 | 99.2 |
プログラム:
x <- 1:15
y <- c(2.9, 5.2, 9.1, 15.5, 25, 37.8, 52.6, 66.9,
       78.6, 87, 92.4, 95.7, 97.6, 98.6, 99.2)
dat <- data.frame(x=x, y=y)
# eq. 1: y ~ a/(1+b*exp(-c*x)) であてはめ
ans <- nls(y ~ a/(1+b*exp(-c*x)), start=list(a=100, b=1, c=1), data=dat)
ans$m$getPars()
summary(ans)
plot(x, y, pch=19, col="red")
x2 <- seq(1, 15, by=0.01)
dat2 <- data.frame(x=x2)
y2 <- predict(ans, newdata=dat2)
lines(x2, y2, col="blue")
# eq. 2: y ~ A/(1+exp((B-x)/C)) であてはめ(初期値を選ぶ苦労がない)
ans2 <- nls(y ~ SSlogis(x, A, B, C), data=dat)
(p <- ans2$m$getPars()) # パラメータを取り出す
p[1]           # eq.1 の a
exp(p[2]/p[3]) # eq.1 の b
1/p[3]         # eq.1 の c
summary(ans2)

実行結果:
> x <- 1:15
> y <- c(2.9, 5.2, 9.1, 15.5, 25, 37.8, 52.6, 66.9,
+        78.6, 87, 92.4, 95.7, 97.6, 98.6, 99.2)
> dat <- data.frame(x=x, y=y)
> ans <- nls(y ~ a/(1+b*exp(-c*x)), start=list(a=100, b=1, c=1), data=dat) # eq.1
> ans$m$getPars()
         a          b          c
99.9482906 60.3888714  0.6006903
> summary(ans)

Formula: y ~ a/(1 + b * exp(-c * x))

Parameters:
   Estimate Std. Error t value Pr(>|t|)
a 9.995e+01  1.619e-02  6175.2   <2e-16 ***
b 6.039e+01  1.333e-01   452.9   <2e-16 ***
c 6.007e-01  3.519e-04  1706.8   <2e-16 ***
---
Signif. codes:  0 ‘***’ 0.001 ‘**’ 0.01 ‘*’ 0.05 ‘.’ 0.1 ‘ ’ 1

Residual standard error: 0.02741 on 12 degrees of freedom

Number of iterations to convergence: 11
Achieved convergence tolerance: 9.2e-08

> plot(x, y, pch=19, col="red")
> x2 <- seq(1, 15, by=0.01)
> dat2 <- data.frame(x=x2)
> y2 <- predict(ans, newdata=dat2)
> lines(x2, y2, col="blue")
> ans2 <- nls(y ~ SSlogis(x, A, B, C), data=dat) # eq. 2: y = A/(1+exp((B-x)/C))
> (p <- ans2$m$getPars()) # パラメータを取り出す
        A         B         C
99.948291  6.826821  1.664751
> p[1]           # y = a/(1+b*exp(-c*x)) の a
      A
99.9483
> exp(p[2]/p[3]) # y = a/(1+b*exp(-c*x)) の b
       B
60.38887
> 1/p[3]         # y = a/(1+b*exp(-c*x)) の c
        C
0.6006903
> summary(ans2)

Formula: y ~ SSlogis(x, A, B, C)

Parameters:
   Estimate Std. Error t value Pr(>|t|)
A 9.995e+01  1.619e-02    6175   <2e-16 ***
B 6.827e+00  1.178e-03    5793   <2e-16 ***
C 1.665e+00  9.754e-04    1707   <2e-16 ***
---
Signif. codes:  0 ‘***’ 0.001 ‘**’ 0.01 ‘*’ 0.05 ‘.’ 0.1 ‘ ’ 1

Residual standard error: 0.02741 on 12 degrees of freedom

Number of iterations to convergence: 0
Achieved convergence tolerance: 4.574e-08