例題:
「表 1 に示すようなデータに曲線をあてはめなさい。」
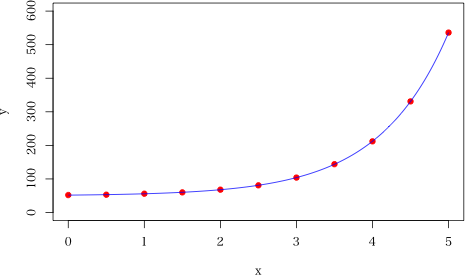
| X | 0.0 | 0.5 | 1.0 | 1.5 | 2.0 | 2.5 | 3.0 | 3.5 | 4.0 | 4.5 | 5.0 |
|---|---|---|---|---|---|---|---|---|---|---|---|
| Y | 52 | 53 | 56 | 60 | 68 | 81 | 104 | 144 | 212 | 331 | 536 |
プログラム:
x <- c(0, 0.5, 1, 1.5, 2, 2.5, 3, 3.5, 4, 4.5, 5)
y <- c(52, 53, 56, 60, 68, 81, 104, 144, 212, 331, 536)
dat <- data.frame(x=x, y=y)
ans <- nls(y ~ a*b^x+c, data=dat, start=list(a=2, b=3, c=1)) # 非線形最小二乗法による解
summary(ans)
plot(x, y, pch=19, col="red", ylim=c(0, 600))
x2 <- seq(0, 5, by=0.01)
y2 <- predict(ans, newdata=data.frame(x=x2))
lines(x2, y2, col="blue")

実行例:
> x <- c(0, 0.5, 1, 1.5, 2, 2.5, 3, 3.5, 4, 4.5, 5)
> y <- c(52, 53, 56, 60, 68, 81, 104, 144, 212, 331, 536)
> dat <- data.frame(x=x, y=y)
> ans <- nls(y ~ a*b^x+c, data=dat, start=list(a=2, b=3, c=1)) # 非線形最小二乗法による解
> summary(ans)

Formula: y ~ a * b^x + c

Parameters:
   Estimate Std. Error t value Pr(>|t|)
a  2.028234   0.012445   163.0 2.25e-15 ***
b  2.991960   0.003687   811.5  < 2e-16 ***
c 49.735090   0.118148   421.0  < 2e-16 ***
---
Signif. codes:  0 ‘***’ 0.001 ‘**’ 0.01 ‘*’ 0.05 ‘.’ 0.1 ‘ ’ 1

Residual standard error: 0.2296 on 8 degrees of freedom

Number of iterations to convergence: 2
Achieved convergence tolerance: 3.627e-06

> plot(x, y, pch=19, col="red", ylim=c(0, 600))
> x2 <- seq(0, 5, by=0.01)
> y2 <- predict(ans, newdata=data.frame(x=x2))
> lines(x2, y2, col="blue")