例題:
「表 1 のに示すようなデータに曲線をあてはめなさい。」
| X | 1 | 2 | 3 | 4 | 5 | 6 | 7 | 8 | 9 | 10 |
|---|---|---|---|---|---|---|---|---|---|---|
| Y | 2 | 16 | 54 | 128 | 250 | 432 | 686 | 1024 | 1458 | 2000 |
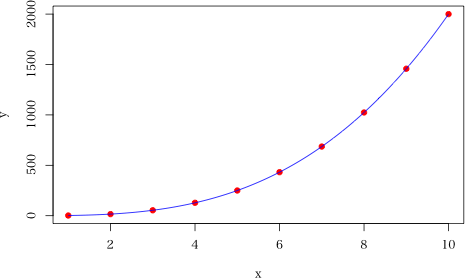
プログラム:
x <- 1:10
# nls で当てはめるデータは,完全に当てはまるテストデータであってはならないため,最後のデータに微少量を加えておく
y <- c(2, 16, 54, 128, 250, 432, 686, 1024, 1458, 2000.00001)
dat <- data.frame(x=x, y=y)
ans <- nls(y ~ a*x^b, data=dat, start=list(a=2, b=3)) # 非線形最小二乗法による解
summary(ans)
plot(x, y, pch=19, col="red")
x2 <- seq(1, 10, by=0.01)
y2 <- predict(ans, newdata=data.frame(x=x2))
lines(x2, y2, col="blue")

実行例:
> x <- 1:10
> y <- c(2, 16, 54, 128, 250, 432, 686, 1024, 1458, 2000.00001)
> dat <- data.frame(x=x, y=y)
> ans <- nls(y ~ a*x^b, data=dat, start=list(a=2, b=3), control=list(maxiter=1000)) # 非線形最小二乗法による解
> summary(ans)

Formula: y ~ a * x^b

Parameters:
   Estimate Std. Error   t value Pr(>|t|)
a 2.000e+00  1.950e-08 102585245   <2e-16 ***
b 3.000e+00  4.415e-09 679538672   <2e-16 ***
---
Signif. codes:  0 ‘***’ 0.001 ‘**’ 0.01 ‘*’ 0.05 ‘.’ 0.1 ‘ ’ 1

Residual standard error: 1.741e-06 on 8 degrees of freedom

Number of iterations to convergence: 1
Achieved convergence tolerance: 8.894e-07

> plot(x, y, pch=19, col="red")
> x2 <- seq(1, 10, by=0.01)
> y2 <- predict(ans, newdata=data.frame(x=x2))
> lines(x2, y2, col="blue")