例題:
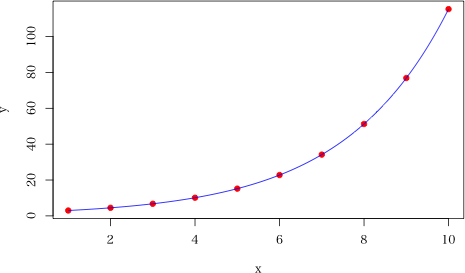
「表 1 のに示すようなデータに曲線をあてはめなさい。」
| X | 1 | 2 | 3 | 4 | 5 | 6 | 7 | 8 | 9 | 10 |
|---|---|---|---|---|---|---|---|---|---|---|
| Y | 3.000 | 4.500 | 6.750 | 10.125 | 15.188 | 22.781 | 34.172 | 51.258 | 76.887 | 115.330 |
プログラム:
# quartz(width=500/72, height=350/72)
x <- 1:10
y <- c(3, 4.5, 6.75, 10.125, 15.188, 22.781, 34.172, 51.258, 76.887, 115.33)
dat <- data.frame(x=x, y=y)
ans <- nls(y ~ a*b^x, data=dat, start=list(a=1, b=1)) # 非線形最小二乗法による解
summary(ans)
plot(x, y, pch=19, col="red")
x2 <- seq(1, 10, by=0.01)
y2 <- predict(ans, newdata=data.frame(x=x2))
lines(x2, y2, col="blue")

実行例:
> x <- 1:10
> y <- c(3, 4.5, 6.75, 10.125, 15.188, 22.781, 34.172, 51.258, 76.887, 115.33)
> dat <- data.frame(x=x, y=y)
> ans <- nls(y ~ a*b^x, data=dat, start=list(a=1, b=1)) # 非線形最小二乗法による解
> summary(ans)

Formula: y ~ a * b^x

Parameters:
   Estimate Std. Error t value Pr(>|t|)
a 2.000e+00  2.118e-05   94445   <2e-16 ***
b 1.500e+00  1.712e-06  876380   <2e-16 ***
---
Signif. codes:  0 ‘***’ 0.001 ‘**’ 0.01 ‘*’ 0.05 ‘.’ 0.1 ‘ ’ 1

Residual standard error: 0.0002096 on 8 degrees of freedom

Number of iterations to convergence: 8
Achieved convergence tolerance: 1.262e-07

> plot(x, y, pch=19, col="red")
> x2 <- seq(1, 10, by=0.01)
> y2 <- predict(ans, newdata=data.frame(x=x2))
> lines(x2, y2, col="blue")