目的
prcomp 関数が返す結果を LaTeX ソースとして出力する。
使用法
xtable.prcomp(obj, caption="caption", label="label", pcs=0, digits=3, rev=-1.5, booktabs=FALSE)
引数
obj prcomp が返すオブジェクト
caption="caption" キャプション
label="label" ラベル
pcs 主成分の個数
digits=3 主成分負荷量の表示における小数点以下の桁数
rev=-1.5 行間を詰めるための,逆改行の大きさをミリ単位で指定(逆改行しない場合には 0 を指定する)
booktabs=FALSE TRUE なら \hline の代わりに \toprule, \midrule, \bottomrule を使う
ソース
インストールは,以下の 1 行をコピーし,R コンソールにペーストする
source("http://aoki2.si.gunma-u.ac.jp/R/src/xtable-factanal.R", encoding="euc-jp")
xtable.prcomp <- function(obj, caption="caption", label="label", pcs=0, digits=3, rev=-1.5, booktabs=FALSE, type=c("latex", "html")) {
# prcomp 関数が返すオブジェクトを LaTeX ソースとして出力する
loadings <- t(t(obj$rotation)*obj$sdev)
if (pcs == 0 || pcs > ncol(loadings)) {
pcs <- sum(colSums(loadings^2) >= 1)
}
loadings.output(loadings[, 1:pcs, drop=FALSE], caption, label, digits, rev, booktabs, type=match.arg(type), pc=TRUE, promax=FALSE)
}
xtable.factanal <- function(obj, caption="caption", label="label", digits=3, rev=-1.5, booktabs=FALSE, type=c("latex", "html")) {
# factanal 関数が返すオブジェクトを LaTeX ソースとして出力する
loadings.output(obj$loadings, caption, label, digits, rev, booktabs, type=match.arg(type), pc=FALSE, promax=any(grepl("promax", obj$call)))
}
loadings.output <- function(loadings, caption, label, digits, rev, booktabs, type, pc, promax) {
if (pc) {
pc <- "主成分"
eig="固有値"
contr="& 寄与率"
} else {
pc <- "因子"
eig="因子負荷量二乗和"
contr="& 共通性"
}
n <- nrow(loadings)
factors <- ncol(loadings)
communality <- rowSums(loadings^2)
loadings <- cbind(loadings, communality)
eva <- colSums(loadings^2)
con <- eva/n*100
cum <- cumsum(con)
loadings <- rbind(loadings, eva, con, cum)
loadings[n+1:3, factors+1] <- NA
rownames(loadings)[n+1:3] <- c(eig, "寄与率(\\%)", "累積寄与率(\\%)")
vnames <- rownames(loadings)
# rotation <- as.character(a$call)
# print(unlist(strsplit(rotation, " ")))
if (booktabs) {
TOPRULE <- "toprule"
MIDRULE <- "midrule"
BOTTOMRULE <- "bottomrule"
} else {
TOPRULE <- MIDRULE <- BOTTOMRULE <- "hline"
}
align <- paste(rep("r", factors+2), collapse="")
if (type == "latex") {
cat(sprintf('\\begin{table}[htbp]\n\\caption{%s}\n\\label{%s}\n\\centering\n\\begin{tabular}{%s} \\%s\n', caption, label, align, TOPRULE))
cat(" &", paste(paste("第", 1:factors, pc, sep=""), collapse=" & "), contr, sprintf("\\\\ \\%s \n", MIDRULE))
n <- n+3
for (i in 1:n) {
cat(vnames[i])
format <- sprintf(" & $%%.%if$", ifelse(i >= n-1, 1, digits))
for (j in 1:(factors+1)) {
if (is.na(loadings[i,j])) {
cat(" & ")
}
else {
cat(sprintf(format, loadings[i,j]))
}
}
cat("\\\\")
if (i == n-3) cat(sprintf("\\%s", MIDRULE))
else if (i < n) cat(sprintf("[%smm]", rev))
else if (i == n) cat(sprintf("\\%s", BOTTOMRULE))
cat("\n")
if (i == n-3 && promax) break
}
cat("\\end{tabular}\\end{table}\n")
}
}
使用例
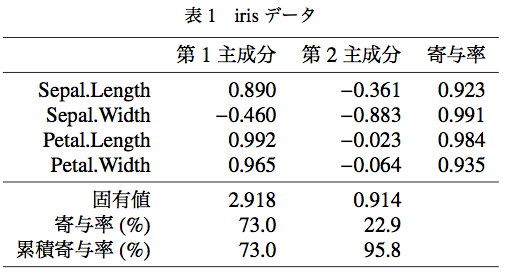
# a <- prcomp(iris[, 1:4], scale.=TRUE)
# xtable(a, "irisデータ", "table2", pcs=2)
LaTeX でタイプセットすると以下のようになる。