 xtable ライブラリ中にも xtable.glm がある。そちらを使うときには
librqry(xtable)
xtable:::xtable.glm(ans)
xtable ライブラリ中にも xtable.glm がある。そちらを使うときには
librqry(xtable)
xtable:::xtable.glm(ans)
目的
glm 関数が返すオブジェクトを LaTeX ソースとして出力する。
使用法
xtable.glm(obj, caption="caption", label="label", align="lrrrr", digits=rep(3, 4),
rev=-1.5, booktabs=FALSE, type=c("latex", "html")
引数
obj glm が返すオブジェクト
caption="caption" キャプション
label="label" ラベル
align="lrrrr" 各フィールドにおける要素の配置(l,c,r)をひとつの文字列で表す
digits=rep(3, 4) 小数点以下の桁数
rev=-1.5 行間を詰めるための,逆改行の大きさをミリ単位で指定(逆改行しない場合には 0 を指定する)
booktabs=FALSE TRUE なら \hline の代わりに \toprule, \midrule, \bottomrule を使う
type デフォルトは latex。html ソースを出力する場合には html を指定する
ソース
インストールは,以下の 1 行をコピーし,R コンソールにペーストする
source("http://aoki2.si.gunma-u.ac.jp/R/src/xtable-glm.R", encoding="euc-jp")
xtable.glm <- function(obj, caption="caption", label="label", vif=FALSE, align="lrrrr", digits=rep(3, 4), rev=-1.5, booktabs=FALSE, type=c("latex", "html"), suf=FALSE) {
# glm 関数が返すオブジェクトを LaTeX または html ソースとして出力する
conv <- function(s) { # 添字を数式モードで
if (suf) paste0("$", sub("([0-9]+$)", "_{\\1}", s), "$") else s
}
ans2 <- summary(obj)
ans <- data.frame(ans2$coefficients)
if (booktabs) {
TOPRULE <- "toprule"
MIDRULE <- "midrule"
BOTTOMRULE <- "bottomrule"
}
else {
TOPRULE <- MIDRULE <- BOTTOMRULE <- "hline"
}
ans <- rbind(ans[-1,], ans[1,])
rownames(ans)[nrow(ans)] <- "定数項"
colnames(ans) <- c("偏回帰係数", "標準誤差", "$z$値", "$P$値")
n <- nrow(ans)
if (match.arg(type) == "latex") {
cat(sprintf('\\begin{table}[htbp]\n\\caption{%s}\n\\label{%s}\n\\centering\n\\begin{tabular}{%s} \\%s\n', caption, label, align, TOPRULE))
cat(paste(c("", colnames(ans)), collapse=" & "))
cat(sprintf("\\\\ \\%s \n", MIDRULE))
for (i in 1:n) {
cat(conv(rownames(ans)[i]))
for (j in 1:4) {
if (is.na(ans[i,j])) {
cat(" & ")
}
else if (j == 4 && ans[i,j] < 0.001) {
cat(" & $< 0.001$")
}
else {
format <- sprintf(" & $%%.%if$", digits[j])
cat(sprintf(format, ans[i,j]))
}
}
cat("\\\\")
if (i < n-1) cat(sprintf("[%smm]", rev))
if (i == n-1) cat(sprintf("\\%s\n", MIDRULE))
cat("\n")
}
cat(sprintf("\\%s\n", BOTTOMRULE))
cat(" \\end{tabular}\\end{table}\n")
}
else {
align <- unlist(strsplit(align, ""))[-1]
align <- sub("r", "right", align)
align <- sub("l", "left", align)
align <- sub("c", "center", align)
colnames(ans) <- c("偏回帰係数", "標準誤差", "\\(z\\) 値", "\\(P\\) 値")
cat("<TABLE border=1>\n")
cat(sprintf("<CAPTION ALIGN='top'> %s </CAPTION>\n", caption))
cat(paste(c("<TR> <TH> ", colnames(ans)), collapse=" </TH> <TH> "))
cat(" </TH> </TR>\n")
for (i in 1:n) {
cat(" <TR> <TD>", rownames(ans)[i])
for (j in 1:4) {
if (is.na(ans[i,j])) {
cat(sprintf(" </TD> <TD align='%s'> ", align[j]))
}
else if (j == 4 && ans[i,j] < 0.001) {
cat(sprintf(" </TD> <TD align='%s'> < 0.001 ", align[j]))
}
else {
format <- sprintf(" </TD> <TD align='%s'> %%.%if", align[j], digits[j])
cat(sprintf(format, ans[i,j]))
}
}
cat(" </TD> </TR>\n")
}
cat(" </TABLE>\n")
}
}
使用例
iris2 <- iris[51:150,]
iris2$Species <- factor(iris2$Species)
ans <- glm(Species ~ ., iris2, family="binomial")
librqry(xtable) # 関数名として xtable.glm を使うなら不要
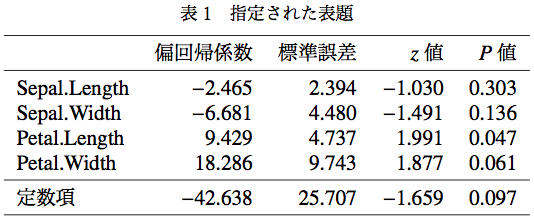
xtable(ans, "指定された表題", "label-1")
LaTeX でタイプセットすると以下のようになる。
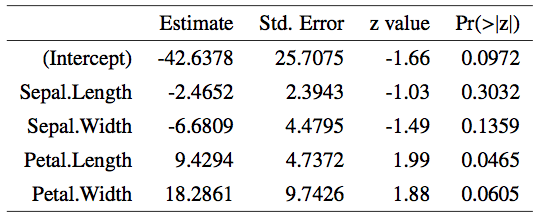
xtable ライブラリ中にも xtable.glm がある。そちらを使うときには
librqry(xtable)
xtable:::xtable.glm(ans)