目的
ftable 関数が返す多重クロス集計のオブジェクトにより,多重クロス集計表をパーセント付きで LaTeX ソースとして出力する。
使用法
xtable.ftable(obj, caption="caption", label="label", percentage=c("row", "col", "none"), same.line=TRUE,
percentage.font=c("small", "footnotesize", "tiny", "normalsize"),
position=c("c", "r", "l"), rev=-1.5, booktabs=FALSE)
引数
obj ftable などが返す ftable オブジェクト
caption="caption" キャプション
label="label" ラベル
percentage=c("row", "col", "none") % を付ける方向
same.line=TRUE % を度数と同じ行に付けるときは TRUE にする
percentage.font=c("small", "footnotesize", "tiny", "normalsize")
LaTeX でのフォントサイズの指定 tiny, footnotesize など
position=c("c", "r", "l") フィールド内での配置 "c", "r", "l" のいずれか
rev=-1.5 行間を詰めるための,逆改行の大きさをミリ単位で指定(逆改行しない場合には 0 を指定する)
booktabs=FALSE TRUE なら \hline の代わりに \toprule, \midrule, \bottomrule を使う
ソース
インストールは,以下の 1 行をコピーし,R コンソールにペーストする
source("http://aoki2.si.gunma-u.ac.jp/R/src/xtable-ftable.R", encoding="euc-jp")
xtable.ftable <- function( obj, # crosstabsn が返す ftable オブジェクト
caption="caption", # キャプション
label="label", # ラベル
percentage=c("row", "col", "none"), # % を付ける方向
same.line=TRUE, # % を度数と同じ行に付けるときは TRUE にする
percentage.font=c("small", "footnotesize", "tiny", "normalsize"), # LaTeX でのフォントサイズの指定 tiny, footnotesize など
position=c("c", "r", "l"), # フィールド内での配置 "c", "r", "l" のいずれか
rev=-1.5, # 行間を詰めるための,逆改行の大きさをミリ単位で指定(逆改行しない場合には 0 を指定する)
booktabs=FALSE) # TRUE なら \hline の代わりに \toprule, \midrule, \bottomrule を使う
# ftable 関数が返した ftable クラスのオブジェクトを入力し,LaTeX ソースを出力する
# formula で指定する。~ の左辺には1個のみ指定できる
# Sweave から使用するのが便利
# 使用例
# Titanic
# x <- ftable(Survived ~ ., data = Titanic)
# a <- ftable(Survived ~ Sex + Class + Age, data = x)
# xtable(a)
# xtable(ftable(Survived ~ Sex + Class, data = x))
{ row.vars <- attr(obj, "row.vars")
n.row.vars <- length(row.vars)
names.row.vars <- names(row.vars)
m.row.vars <- sapply(row.vars, length)
col.vars <- attr(obj, "col.vars")
n.col.vars <- length(col.vars)
names.col.vars <- names(col.vars)
m.col.vars <- sapply(col.vars, length)
if (n.col.vars != 1) {
stop("col.vars が 1 変数の ftable オブジェクトしか扱えません")
}
nrow <- nrow(obj)
side <- matrix("", nrow, n.row.vars)
n.block <- nrow/m.row.vars[n.row.vars]
side[, n.row.vars] <- unlist(rep(row.vars[n.row.vars], n.block))
for (i in seq_len(n.row.vars-1)) {
every <- prod(m.row.vars[(i+1):n.row.vars])
side[(0:(nrow-1))%%every==0, i] <- unlist(row.vars[i])
}
percentage <- match.arg(percentage)
if (percentage == "none") {
same.line <- FALSE
}
percentage.font <- match.arg(percentage.font)
position <- match.arg(position)
if (booktabs) {
toprule <- "\\toprule"
midrule <- "\\midrule"
}
else {
toprule <- midrule <- "\\hline"
}
col.vars <- c(unlist(col.vars[[1]]), "合計")
fac <- same.line+1
if (same.line) {
pos <- c(rep(position, n.row.vars), rep(paste(position, "@{}", position), m.col.vars+1))
header <- paste(paste(names.row.vars, collapse=" & "), paste("&", paste(col.vars, "\\%", sep=" & ", collapse=" & ")))
fmt <- sprintf("%%d & {\\%s \\textit{%%6.1f}}", percentage.font)
}
else {
pos <- rep(position, m.col.vars+1+n.row.vars)
header <- paste(paste(names.row.vars, collapse=" & "), paste(col.vars, collapse=" & "), sep=" & ")
fmt <- sprintf("{\\%s \\textit{%%5.1f}}", percentage.font)
}
cat("\\begin{table}[htbp]\n",
"\\caption{", caption, "}\n",
"\\label{", label, "}\n",
"\\centering\n",
"\\begin{tabular}{", pos, "} ", toprule, " \n", sep="")
cat(paste(rep("&", n.row.vars), collapse=" "))
cat(sprintf(" \\multicolumn{%i}{c}{%s}\\\\ \\cline{%i-%i}\n",
fac*m.col.vars[1], names.col.vars[1], n.row.vars+1, fac*m.col.vars[1]+n.row.vars))
cat(header, " \\\\ ", midrule, "\n", sep="")
for (k in 1:n.block) {
end <- k*m.row.vars[n.row.vars]
begin <- end-m.row.vars[n.row.vars]+1
block <- addmargins(obj[begin:end, ])
side.block <- rbind(side[begin:end, , drop=FALSE ], c(rep("", n.row.vars-1), "合計"))
if (percentage == "row") {
pct <- block/block[, m.col.vars+1]*100
}
else {
pct <- t(t(block)/block[m.row.vars[n.row.vars]+1,]*100)
}
n <- m.row.vars[n.row.vars]+1
for (i in 1:n) {
cat(sprintf("%s &", side.block[i,]))
if (same.line) {
cat(gsub("NaN", "---", paste(apply(cbind(block[i,], pct[i,]), 1, function(y) sprintf(fmt, y[1], y[2])), collapse=" & ")))
}
else {
cat(paste(block[i,], collapse=" & "), "\\\\ \n")
if (percentage != "none") {
cat(rep(" &", n.row.vars-1))
cat("\\%", gsub("NaN", "---", sprintf(fmt, pct[i, ])), sep=" & ")
}
}
if (percentage != "none") {
cat(" \\\\")
}
if (i < n-1) {
cat(sprintf("[%smm]\n", rev))
}
else if (i == n) {
if (end < nrow) {
cat(sprintf("\\cline{%i-%i}\n", sum(side[end+1,] == "")+1, fac*(m.col.vars[1]+1)+n.row.vars))
}
else {
cat(sprintf("%s\n", toprule))
}
}
else {
cat(sprintf("\\cline{%i-%i}\n", n.row.vars, fac*(m.col.vars[1]+1)+n.row.vars))
}
}
}
cat("\\end{tabular}\n",
"\\end{table}\n", sep="")
}
使用例
# x <- ftable(Survived ~ ., data = Titanic)
# a <- ftable(Survived ~ Sex + Class + Age, data = x)
# library(xtable)
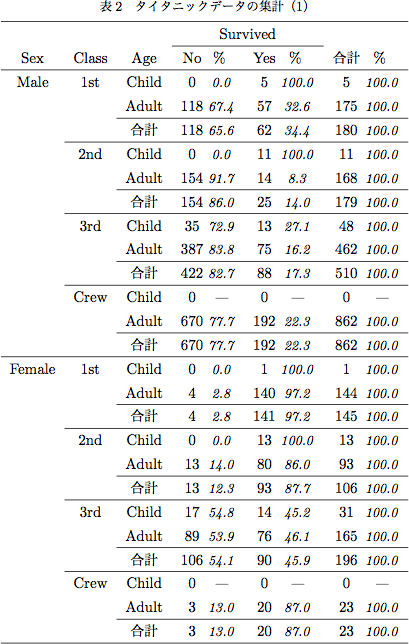
# xtable(a, "タイタニックデータの集計(1)", "table1")
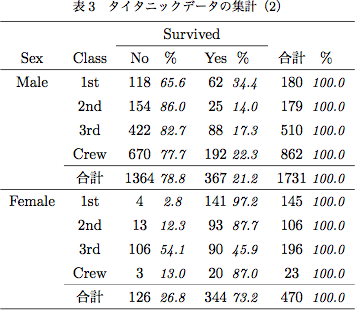
# xtable(ftable(Survived ~ Sex + Class, data = x), "タイタニックデータの集計(2)", "table2")
LaTeX でタイプセットすると以下のようになる。