2 群のヒストグラムを描く Last modified: Aug 27, 2007
目的
2 群のヒストグラムを描く。
使用法
hist2(x1, x2, brks=NULL, ...)
引数
x1 第一群のデータ
x2 第二群のデータ
brks 階級分割点(NULL のときは適切に計算)
... barplot に引き渡す任意の引数
ソース
インストールは,以下の 1 行をコピーし,R コンソールにペーストする
source("http://aoki2.si.gunma-u.ac.jp/R/src/hist2.R", encoding="euc-jp")
# 2 群のヒストグラム
hist2 <- function( x1, # 第一群のデータ
x2, # 第二群のデータ
brks=NULL, # 階級分割点
...) # barplot に引き渡す任意の引数
{
if (is.null(brks)) { # 階級分割点が与えられないときには,適切に設定
brks <- hist(c(x1, x2), right=FALSE, plot=FALSE)$breaks
}
c1 <- hist(x1, breaks=brks, right=FALSE, plot=FALSE)$counts # 度数1
c2 <- hist(x2, breaks=brks, right=FALSE, plot=FALSE)$counts # 度数2
barplot(rbind(c1, c2), beside=TRUE, space=c(0, 0.2), # 棒を並べて描く
names.arg=brks[-length(c1)], axisnames=TRUE, axis.lty=1, ...) # 横軸の目盛りラベル等
}
使用例
set.seed(12345)
x1 <- rnorm(100)*10+50
x2 <- rnorm(100)*12+70
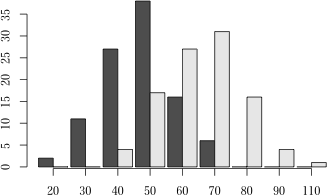
hist2(x1, x2)
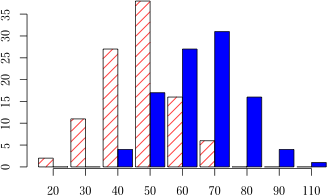
 hist2(x1, x2, col=c("red", "blue"), density=c(10, -2))
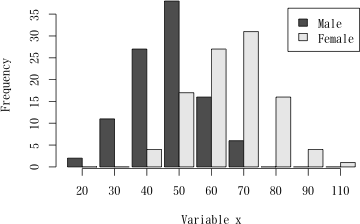
 hist2(x1, x2, legend.text=c("Male", "Female"), xlab="Variable x", ylab="Frequency")
 直前のページへ戻る E-mail to Shigenobu AOKI
