目的
データフレーム上の複数の変数を指定して,クロス集計を行い,必要ならば独立性の検定,フィッシャーの正確検定,コルモゴロフ・スミルノフ検定の何れかを行う。
使用法
cross(i, j, df, row=TRUE, latex=TRUE, captions=NULL, labels=NULL,
test=c("none", "chisq", "fisher", "kruskal"), output="")
引数
i, j データフレーム上で,クロス集計をする二変数が入っている,列の番号または変数名ベクトル
i は表側に来る変数,j は表頭に来る変数
i, j は,それぞれベクトルでもかまわない。i の要素と j の要素のすべての組み合わせでクロス集計を行う
df 読み込んだデータフレームの名前
row デフォルトは行方向の % を取る
列方向なら row=FALSE にする
latex 集計結果を LaTeX ソースとして出力する。タブ区切りで出すだけなら(Word 用など),latex=FALSE にする
captions latex=TRUE の場合,各表の表題を文字列ベクトルとして指定することができる(デフォルトではあり合わせの表題を付ける)。
labels latex=TRUE の場合,各表の label を文字列ベクトルとして指定することができる(デフォルトでは付けない)。
test 検定法を指定する。"chisq", "fisher", "kruskal" の何れか
デフォルトは検定をしない
"kruskal" の場合は,i(つまり表側)の変数を群と見なし,j(つまり表頭)の変数を順序のあるカテゴリーとして検定を行う
output 出力コネクション
デフルトはコンソールに出力
ソース
インストールは,以下の 1 行をコピーし,R コンソールにペーストする
source("http://aoki2.si.gunma-u.ac.jp/R/src/cross.R", encoding="euc-jp")
#####
#
# クロス集計表を作成し,独立性の検定または代表値の差の検定を行う
#
#####
cross <- function(i, # 表側に来る変数が入っているデータフレーム上の列番号または変数名ベクトル
j, # 表側に来る変数が入っているデータフレーム上の列番号または変数名ベクトル
df, # データフレーム
row=TRUE, # 行ごとに 100% となるようにパーセントを取る
latex=TRUE, # LaTeX 形式で度数分布表を出力する(デフォルトは LaTeX 形式)
captions=NULL, # latex=TRUE のときに,各表の表題を表す文字列ベクトルを指定できる(NULL のときはデフォルトの表題)
labels=NULL, # latex=TRUE のときに,各表の label を表す文字列ベクトルを指定できる(NULL のときは付けない)
test=c("none", "chisq", "fisher", "kruskal"), # デフォルト none では検定を行わない。検定を行うときはその種類を指定する
output="", # ファイルに出力するときはファイル名(デフォルトはコンソールに出力)
encoding=getOption("encoding")) # ファイルに出力するときのエンコーディング(デフォルトは OS による)
{
# 下請け関数
cross.sub <- function(ii, jj) # ii, jj はスカラー。ii, jj で指定されたクロス集計を 1 つだけ行う
{
tbl <- table(df[,ii], df[,jj]) # 表の本体は table 関数で作る
tbl <- tbl[rowSums(tbl) > 0,, drop=FALSE] # 行和が 0 になる行を除く(factor 関数の使い方によってはこのような集計表ができる)
tbl <- tbl[,colSums(tbl) > 0, drop=FALSE] # 列和が 0 になる列を除く(同上)
ans <- addmargins(tbl) # 周辺和を付け加える
nr <- nrow(ans) # 集計表の行数
nc <- ncol(ans) # 集計表の列数
colnames(ans)[nc] <- rownames(ans)[nr] <- "合計" # 表頭,表側の該当箇所を「合計」とする
pct <- ans*100 / if (row) ans[,nc] else rep(ans[nr,], each=nr) # row の指示により,行 % か列 % のいずれかを取る
if (latex) { # LaTeX 形式で集計結果を出力する
cat("\n\\begin{table}[htbp]\n", file=output) # \begin{table}[htbp]
if (is.null(captions)) {
cat(sprintf("\\caption{%s : %s}\n", colnames(df)[ii], colnames(df)[jj]), file=output) # \caption{変数名 : 変数名}
}
else {
cat(sprintf("\\caption{%s}\n", captions[index]), file=output) # \caption{○○○○}
}
if (!is.null(labels)) {
cat(sprintf("\\label{%s}\n", labels[index]), file=output) # \labels{○○○○}
}
cat("\\centering\n", file=output) # \centering
cat("\\begin{tabular}{l", rep("c", nc), "} \\hline\n", sep="", file=output) # \begin{tabular}{cc…c} \hline
cat(sprintf("& \\multicolumn{%i}{c}{%s}\\\\ \\cline{2-%i}\n", nc-1, colnames(df)[jj], nc), file=output)
# 表頭の変数名
cat(colnames(df)[ii], colnames(ans), sep=" & ", file=output) # 表側の変数名 & 表頭1 & 表頭2 & … & 合計
cat("\\\\ \\hline\n", file=output) # \\ \hline
for (i in 1:nr) { # 各行について,
cat(rownames(ans)[i], ans[i,], sep=" & ", file=output) # 表側i & 観察数i1 & 観察数i2 & … & 合計
cat("\\\\\n", file=output) # \\
cat("\\%", sprintf("{\\small \\textit{%.1f}}", pct[i,]), sep=" & ", file=output)# % & パーセントi1 & パーセントi2 & … & パーセント
cat("\\\\", file=output) # \\
if (i >= nr-1) {
cat("\\hline\n", file=output) # \hline \n
}
else {
cat("\n", file=output) # そのまま改行 \n
}
}
cat("\\end{tabular}\n", file=output) # \end{tabular}
}
else { # tab で区切って出力する
cat("\n表 ", colnames(df)[ii], ":", colnames(df)[jj], sep="", file=output) # 表 変数名:変数名
cat("\n", colnames(df)[jj], sep="\t", file=output, fill=TRUE) # 表頭の変数名
cat(colnames(df)[ii], colnames(ans), sep="\t", file=output, fill=TRUE) # 表側の変数名 表頭1 表頭2 … 合計
for (i in 1:nr) { # 各行について
cat(rownames(ans)[i], ans[i,], sep="\t", file=output, fill=TRUE) # 表側i 観察数i1 観察数i2 … 合計
cat("%", sprintf("%.1f", pct[i,]), sep="\t", file=output, fill=TRUE) # % パーセントi1 パーセントi2 … パーセント
}
}
if (nr > 2 && nc > 2 && test != "none") { # 2 行× 2 列以上の集計表については,検定オプションあり
if (latex) { # LaTeX 形式の出力なら表の後に追加
cat("\\\\ \\noindent\n", file=output)
}
if (test == "chisq") { # 独立性の検定 chisq を選んだ場合
res <- chisq.test(tbl) # chisq.test を使う
cat(sprintf(if (latex) "$\\chi^2$値 = %.3f, 自由度 = %i, $P$値 = %.3f\n"
else "カイ二乗値 = %.3f, 自由度 = %i, P 値 = %.3f\n",
res$statistic, res$parameter, res$p.value), file=output)
}
else if (test == "fisher") { # 独立性の検定(Fisher の正確検定) fisher を選んだ場合
cat(sprintf(if (latex) "$P_{Fisher}$値 = %.3f\n"
else "P 値(Fisher)= %.3f\n",
fisher.test(tbl)$p.value), file=output)
}
else if (test == "kruskal") { # クラスカル・ウォリスの検定 kruskal を選んだ場合
if (row) { # 行ごとの % が 100% となるようにした row=TRUE の場合
if (nc > 3 && (!is.ordered(df[,jj]) && !is.numeric(df[,jj]))) {
warning(paste("「", colnames(df)[jj], "」は,順序尺度・間隔尺度・比尺度変数でなくてはなりません。", sep=""))
}
res <- kruskal.test(rep(col(tbl), tbl), rep(row(tbl), tbl))
}
else { # 列ごとの % が 100% となるようにした row=FALSE の場合
if (nr > 3 && (!is.ordered(df[,ii]) && !is.numeric(df[,ii]))) {
warning(paste("「", colnames(df)[ii], "」は,順序尺度・間隔尺度・比尺度変数でなくてはなりません。", sep=""))
}
res <- kruskal.test(rep(row(tbl), tbl), rep(col(tbl), tbl))
}
cat(sprintf(if (latex) "$\\chi^2_{kw}$値 = %.3f, 自由度 = %i, $P$値 = %.3f\n"
else "カイ二乗値(kw) = %.3f, 自由度 = %i, P 値 = %.3f\n",
res$statistic, res$parameter, res$p.value), file=output)
}
}
if (latex) { # LaTeX 形式で集計結果を出力する場合は,
cat("\\end{table}\n", file=output) # \end{table}
}
}
getNum <- function(str, df) { # 変数名から列番号を得る
names <- colnames(df)
seq_along(names)[names %in% str]
}
# cross 関数の本体
if (output != "") { # 結果をファイルに出力する場合の処理
output <- file(output, open="w", encoding=encoding)
}
test <- match.arg(test) # test 引数から,完全な検定手法名を得る
if (is.character(i[1])) {
i <- getNum(i, df)
}
if (is.character(j[1])) {
j <- getNum(j, df)
}
index <- 0
for (ii in i) { # i はベクトルまたはスカラー
for (jj in j) { # j はベクトルまたはスカラー
if (ii != jj) { # i, j の全ての組み合わせについて(ii と jj が違うときのみ),
index <- index+1
cross.sub(ii, jj) # クロス集計のための下請け関数 cross.sub を呼ぶ
}
}
}
if (output != "") { # 結果をファイルに出力した場合の後始末
close(output)
}
}
使用例
性別 血液型 職業
1 1 3
2 2 2
1 3 1
1 4 2
1 1 1
2 2 1
2 3 3
1 3 2
2 2 1
2 1 1
のようなファイル test.dat があるとする
入力と変数の定義
df <- read.table("test.dat", header=TRUE)
df[,1] <- factor(df[,1], levels=1:2, labels=c("男", "女"))
df[,2] <- factor(df[,2], levels=1:4, labels=c("A", "B", "O", "AB"))
df[,3] <- factor(df[,3], levels=1:3, labels=c("自由業", "会社員", "無職"))
コンソールに出力するとき
cross(1, 2, df)
ファイルに出力するとき
cross(1, 2, df, output="ファイル名", encoding="EUC-JP")
出力結果例
latex=FALSE の場合
> cross(1, 2:3, df, latex=FALSE)
血液型
性別 A B O AB 合計
男 2 0 2 1 5
% 40.0 0.0 40.0 20.0 100.0
女 1 3 1 0 5
% 20.0 60.0 20.0 0.0 100.0
合計 3 3 3 1 10
% 30.0 30.0 30.0 10.0 100.0
表 性別:職業
職業
性別 自由業 会社員 無職 合計
男 2 2 1 5
% 40.0 40.0 20.0 100.0
女 3 1 1 5
% 60.0 20.0 20.0 100.0
合計 5 3 2 10
% 50.0 30.0 20.0 100.0
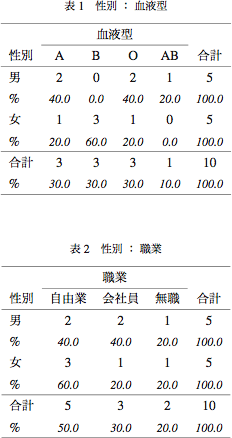
latex=TRUE(デフォルト)の場合
> cross(1, 2:3, df)
\begin{table}[htbp]
\caption{性別 : 血液型}
\begin{center}
\begin{tabular}{lccccc} \hline
& \multicolumn{4}{c}{血液型}\\ \cline{2-5}
性別 & A & B & O & AB & 合計\\ \hline
男 & 2 & 0 & 2 & 1 & 5\\
\% & {\small \textit{40.0}} & {\small \textit{0.0}} & {\small \textit{40.0}} & {\small \textit{20.0}} & {\small \textit{100.0}}\\
女 & 1 & 3 & 1 & 0 & 5\\
\% & {\small \textit{20.0}} & {\small \textit{60.0}} & {\small \textit{20.0}} & {\small \textit{0.0}} & {\small \textit{100.0}}\\\hline
合計 & 3 & 3 & 3 & 1 & 10\\
\% & {\small \textit{30.0}} & {\small \textit{30.0}} & {\small \textit{30.0}} & {\small \textit{10.0}} & {\small \textit{100.0}}\\\hline
\end{tabular}
\\ \noindent
\end{center}
\end{table}
\begin{table}[htbp]
\caption{性別 : 職業}
\begin{center}
\begin{tabular}{lcccc} \hline
& \multicolumn{3}{c}{職業}\\ \cline{2-4}
性別 & 自由業 & 会社員 & 無職 & 合計\\ \hline
男 & 2 & 2 & 1 & 5\\
\% & {\small \textit{40.0}} & {\small \textit{40.0}} & {\small \textit{20.0}} & {\small \textit{100.0}}\\
女 & 3 & 1 & 1 & 5\\
\% & {\small \textit{60.0}} & {\small \textit{20.0}} & {\small \textit{20.0}} & {\small \textit{100.0}}\\\hline
合計 & 5 & 3 & 2 & 10\\
\% & {\small \textit{50.0}} & {\small \textit{30.0}} & {\small \textit{20.0}} & {\small \textit{100.0}}\\\hline
\end{tabular}
\\ \noindent
\end{center}
\end{table}
これを LaTeX でタイプセットすると以下のようになる。