目的
サーストンの一対比較法を行う。
使用法
ThurstonePairedComparison(x)
print.ThurstonePairedComparison(obj, digits=5)
plot.ThurstonePairedComparison(obj, xlab="Score", main="Thurstone's Paired Comparison", file="")
引数
x 一対比較の結果を表す正方行列(colnames, rownames を付けておくのが望ましい)
obj ThurstonePairedComparison が返すオブジェクト
digits 結果の表示桁数
xlab 軸の名称(デフォルトでは Score)
main グラフのタイトル(デフォルトでは Thurstone's Paired Comparison)
file 結果の画像を出力するファイル名。拡張子(.pdf)を含む。
デフォルトでは空文字列で,ファイル出力しない
ソース
インストールは,以下の 1 行をコピーし,R コンソールにペーストする
source("http://aoki2.si.gunma-u.ac.jp/R/src/ThurstonePairedComparison.R", encoding="euc-jp")
# サーストンの一対比較法 Thurstone's Paired Comparison
ThurstonePairedComparison <- function(x) # 一対比較の結果を表す正方行列
{
nc <- ncol(x) # 項目数
stopifnot(nc == nrow(x)) # 正方行列でないと分析中止
if (is.null(dimnames(x))) { # 項目名がないときは補完する
labels <- LETTERS[1:nc]
}
else if(is.null(colnames(x))) {
labels <- rownames(x)
}
else {
labels <- colnames(x)
}
n <- x+t(x) # 対戦総数(引き分けとか試合数不足を考慮)
diag(n) <- 1 # 0 による割り算が起きないように対角成分を調整
x <- qnorm(x/n) # 割合を求め,対応する Z スコアを求める
diag(x) <- NA # 対角は NA にする
score <- rowMeans(x, na.rm=TRUE) # 行和が求める答え
names(score) <- labels # スコアに項目名をつける
return(structure(list(score=score, sorted.score=sort(score)), class="ThurstonePairedComparison"))
}
# print メソッド
print.ThurstonePairedComparison <- function( obj, # ThurstonePairedComparison が返すオブジェクト
digits=5)
{
cat("\nスコア\n\n")
print(round(obj$score, digits=digits))
cat("\nソートされたスコア\n\n")
print(round(obj$sorted.score, digits=digits))
}
# plot メソッド
plot.ThurstonePairedComparison <- function( obj, # ThurstonePairedComparison が返すオブジェクト
xlab="Score", # 結果グラフの横軸名
main="Thurstone's Paired Comparison", # 結果グラフの表題
file="") # 結果グラフをファイル出力するときにファイル名
{
if (file != "") pdf(file, width=540/72, height=160/72, onefile=FALSE)
score <- obj$score
plot(score, rep(0, length(score)), pch=19, xlab=xlab, main=main, xaxt="n",
xlim=range(pretty(score)), ylab="", yaxt="n", ylim=c(0,0.2),
bty="n", xpd=TRUE)
text(score, 0.0, names(score), pos=3)
axis(1, pos=0)
if (file != "") dev.off()
}
使用例
# 一対比較の結果
A 行 B 列の72は,「A は B より優れているとしたものが 72 名」のようなことを表すものとする。
対角成分は 0 としておく。
A B C D E F G H
A 0 72 73 70 73 73 69 60
B 2 0 32 1 18 6 2 1
C 1 42 0 1 19 17 2 1
D 4 73 73 0 59 63 44 22
E 1 56 55 15 0 24 9 7
F 1 68 57 11 50 0 15 10
G 5 72 72 30 65 59 0 18
H 14 73 73 52 67 64 56 0
> x <- matrix(c(
+ 0, 72, 73, 70, 73, 73, 69, 60,
+ 2, 0, 32, 1, 18, 6, 2, 1,
+ 1, 42, 0, 1, 19, 17, 2, 1,
+ 4, 73, 73, 0, 59, 63, 44, 22,
+ 1, 56, 55, 15, 0, 24, 9, 7,
+ 1, 68, 57, 11, 50, 0, 15, 10,
+ 5, 72, 72, 30, 65, 59, 0, 18,
+ 14, 73, 73, 52, 67, 64, 56, 0), byrow=TRUE, ncol=8)
> rownames(x) <- colnames(x) <- LETTERS[1:8]
> (a <- ThurstonePairedComparison(x)) # 結果を付値しておき,後で使う
スコア
A B C D E F G H
1.79165 -1.50557 -1.39753 0.62813 -0.66134 -0.37066 0.48890 1.02641
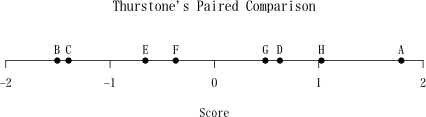
ソートされたスコア
B C E F G D H A
-1.50557 -1.39753 -0.66134 -0.37066 0.48890 0.62813 1.02641 1.79165
> print(a, digits=2) # 出力桁を指定して表示
スコア
A B C D E F G H
1.79 -1.51 -1.40 0.63 -0.66 -0.37 0.49 1.03
ソートされたスコア
B C E F G D H A
-1.51 -1.40 -0.66 -0.37 0.49 0.63 1.03 1.79
> plot(a, file="Thurstone.pdf") # PDF ファイルに画像を描き出す