シェッフェの一対比較法 Last modified: Aug 21, 2009
目的
シェッフェの一対比較法を行う。
使用法
ScheffePairedComparison(A, B, labels=NULL)
print.ScheffePairedComparison(obj, digits=5)
plot.ScheffePairedComparison(obj, xlab="Score", main="Scheffe's Paired Comparison", file="")
引数
A 一対比較の結果を表す行列
B 評点を表すベクトル
labels 評価対象の名称
obj ScheffePairedComparison が返すオブジェクト
digits 結果の表示桁数
xlab 軸の名称(デフォルトでは Score)
main グラフのタイトル(デフォルトでは Scheffe's Paired Comparison)
file 結果の画像を出力するファイル名。拡張子は .pdf
デフォルトでは空文字列で,ファイル出力しない
ソース
インストールは,以下の 1 行をコピーし,R コンソールにペーストする
source("http://aoki2.si.gunma-u.ac.jp/R/src/ScheffePairedComparison.R", encoding="euc-jp")
# シェッフェの一対比較法 Scheffe's Paired Comparison
ScheffePairedComparison <- function( A, # 一対比較の結果を表す正方行列
B, # 得点ベクトル
labels=NULL) # 評価対象のラベル
{
n <- (1+sqrt(1+8*nrow(A)))/2 # 評価対象の個数
if (is.null(labels)) labels <- LETTERS[1:n] # 評価対象名の補完
AB <- A%*%B # 従属変数ベクトルの作成
x <- combn(n, 2) # 独立変数行列の作成
nc <- ncol(x)
indep <- matrix(0, nc, n)
indep[cbind(1:nc, x[1,])] <- 1
indep[cbind(1:nc, x[2,])] <- -1
ans <- lm(AB ~ indep[,2:n]) # 重回帰分析
y <- coefficients(ans) # 回帰係数がスコアになる
names(y) <- labels
return(structure(list(score=y, sorted.score=sort(y)), class="ScheffePairedComparison"))
}
# print メソッド
print.ScheffePairedComparison <- function(obj, # ScheffePairedComparison が返すオブジェクト
digits=5) # 結果の表示桁数
{
cat("\nスコア\n\n")
print(round(obj$score, digits=digits))
cat("\nソートされたスコア\n\n")
print(round(obj$sorted.score, digits=digits))
}
# plot メソッド
plot.ScheffePairedComparison <- function(obj, # ScheffePairedComparison が返すオブジェクト
xlab="Score", # 結果グラフの横軸名
main="Scheffe's Paired Comparison", # 結果グラフの表題
file="") # 結果グラフをファイル出力するときにファイル名
{
if (file != "") pdf(file, width=540/72, height=160/72, onefile=FALSE)
score <- obj$score
plot(score, rep(0, length(score)), pch=19, xlab=xlab, main=main, , xaxt="n",
xlim=range(pretty(score)), ylab="", yaxt="n", ylim=c(0,0.2),
bty="n", xpd=TRUE)
text(score, 0.0, names(score), pos=3)
axis(1, pos=0)
if (file != "") dev.off()
}
使用例
# B: 評価得点のベクトル
α が β より「とても優れている」なら 4
α が β より「優れている」 なら 2
α と β が 「同等」 なら 0
β が α より「優れている」 なら -2
β が α より「とても優れている」なら -4
# A: 一対比較の結果(列数は得点段階数,行数は「評価対象数*(評価対象数-1)/2」。
以下では,5 段階の得点付け,評価対象数は 4。
[,1] [,2] [,3] [,4] [,5]
[1,] 10 13 41 33 10
[2,] 3 12 47 26 19
[3,] 2 9 32 12 52
[4,] 23 32 30 12 10
[5,] 27 11 31 13 25
[6,] 21 7 10 33 36
> B <- c(4, 2, 0, -2, -4)
> A <- matrix(c(
+ 10, 13, 41, 33, 10,
+ 3, 12, 47, 26, 19,
+ 2, 9, 32, 12, 52,
+ 23, 32, 30, 12, 10,
+ 27, 11, 31, 13, 25,
+ 21, 7, 10, 33, 36), byrow=TRUE, ncol=5)
> (a <- ScheffePairedComparison(A, B, LETTERS[1:4])) # print メソッドで結果を表示
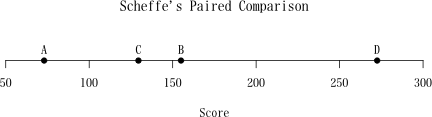
スコア
A B C D
73.0 155.0 129.5 272.5
ソートされたスコア
A C B D
73.0 129.5 155.0 272.5
> plot(a) # plot メソッドで結果を描画
 直前のページへ戻る E-mail to Shigenobu AOKI
