Deming 法による回帰直線のパラメータ Last modified: Sep 03, 2009
目的

Deming 法による回帰直線のパラメータを求める。

使用法

Deming(x, y, n=1, a=1)

# print メソッド
print.deming(obj, digits=5, sig=0.95)

# plot メソッド
plot.deming(obj, posx="topleft", posy=NULL, xlab=obj$names.xy[1], ylab=obj$names.xy[2],	hist=FALSE, ...)

引数

x             独立変数ベクトル
y             従属変数ベクトル
n             ブートストラップ法で信頼区間を求めるときの回数
              デフォルトは 1。この場合には信頼区間を求めない
a             分散比
              デフォルトは 1。
              大きくすると普通の回帰直線に近づく。小さくすると本法の特徴が強く表れる。
obj           "deming" オブジェクト
digits        表示桁数
sig           ブートストラップ法による信頼限界を求めるときの信頼度(デフォルトで 95% 信頼限界)
posx, posy    legend 関数のための位置引数("topleft", "bottomright" なども可)
xlab, ylab    軸の名前
hist          ブートストラップ法による結果のヒストグラム表示をするかどうか
...           plot 関数に渡されるその他の引数

ソース

インストールは,以下の 1 行をコピーし,R コンソールにペーストする
source("http://aoki2.si.gunma-u.ac.jp/R/src/Deming.R", encoding="euc-jp")

# Deming 法による回帰直線のパラメータ推定
Deming <- function(  x,                                              # 独立変数ベクトル
                        y,                                              # 従属変数ベクトル
                        n=1,                                            # ブートストラップ法で信頼区間を求めるときの回数
                        a=1)                                            # 分散比
{
        Deming0 <- function(x, y)                                    # 1 組のデータについて,切片と傾きの推定値を計算する
        {
                sxx <- sum((x-mean(x))^2)
                syy <- sum((y-mean(y))^2)
                sxy <- sum((x-mean(x))*(y-mean(y)))
                if (sxy != 0) {
                        Slope <- (syy-a*sxx+sqrt((syy-a*sxx)^2+4*a*sxy^2))/(2*sxy)
                        Intercept <- mean(y)-Slope*mean(x)
                } else {
                        Slope <- Intercept <- NA
                }
                return(c(Intercept=Intercept, Slope=Slope))
        }
        Driver <- function(x, y)                                     # ブートストラップ法のためのドライバー
        {
                n <- length(x)
                suffix <- sample(n, n, replace=TRUE)                 # リサンプリング
                return(Deming0(x[suffix], y[suffix]))                   # リサンプリングしたデータについてパラメータを推定
        }
        names.xy <- c(deparse(substitute(x)), deparse(substitute(y)))        # 変数名を控えておく
        OK <- complete.cases(x, y)                                   # 欠損値を持つケースを除く
        x <- x[OK]
        y <- y[OK]
        ans <- list(coefficients=Deming0(x, y),                              # 引数に対してパラメータを推定する
                    names.xy=names.xy, x=x, y=y)
        if (n > 1) {
                ans2 <- replicate(n, Driver(x, y))                   # ブートストラップを n 回実行
                ans <- append(ans, list(intercepts=ans2[1,], slopes=ans2[2,]))
        }
        class(ans) <- "deming"                                               # print, plot メソッドのためにクラス名をつけておく
        return(ans)
}
# print メソッド
print.deming <- function(    obj,                                    # "deming" オブジェクト
                                digits=5,                               # 表示桁数
                                sig=0.95)                               # 信頼度
{
        if (length(obj) == 4) {
                cat("Intercept:", round(obj$coefficients[1], digits),
                    "    Slope:", round(obj$coefficients[2], digits), "\n")
        }
        else {
                alpha <- (1-sig)/2
                LCL <- c(quantile(obj$intercepts, alpha, na.rm=TRUE), quantile(obj$slopes, alpha, na.rm=TRUE))
                UCL <- c(quantile(obj$intercepts, 1-alpha, na.rm=TRUE), quantile(obj$slopes, 1-alpha, na.rm=TRUE))
                ans <- data.frame(obj$coefficients, LCL, UCL)
                dimnames(ans) <- list(c("Intercept:", "Slope:"),
                                      c("Estimate", paste(c(alpha, 1-alpha), "%", sep="")))
                print(round(ans, digits=digits))
        }
}
# plot メソッド
plot.deming <- function(obj,                                         # "deming" オブジェクト
                        posx="topleft", posy=NULL,                      # legend 関数のための位置引数
                        xlab=obj$names.xy[1], ylab=obj$names.xy[2],     # 軸の名前
                        hist=FALSE,                                     # ヒストグラムを描くとき TRUE にする
                        ...)                                            # その他の任意の plot 関数の引数
{
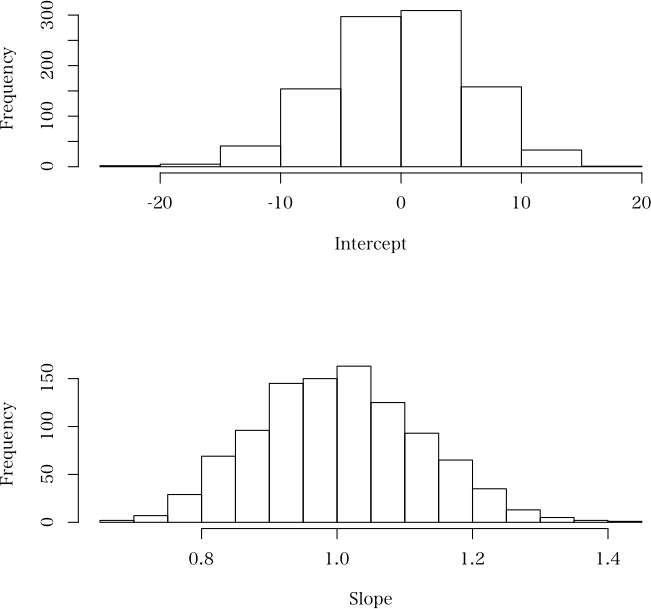
        if (hist && length(obj) == 6) {                                   # ブートストラップの結果を,hist=TRUE のときに,ヒストグラムで表示する
                layout(matrix(1:2, 2))
                hist(obj$intercepts, xlab="Intercept", main="", right=FALSE)
                hist(obj$slopes, xlab="Slope", main="", right=FALSE)
                layout(1)
        }
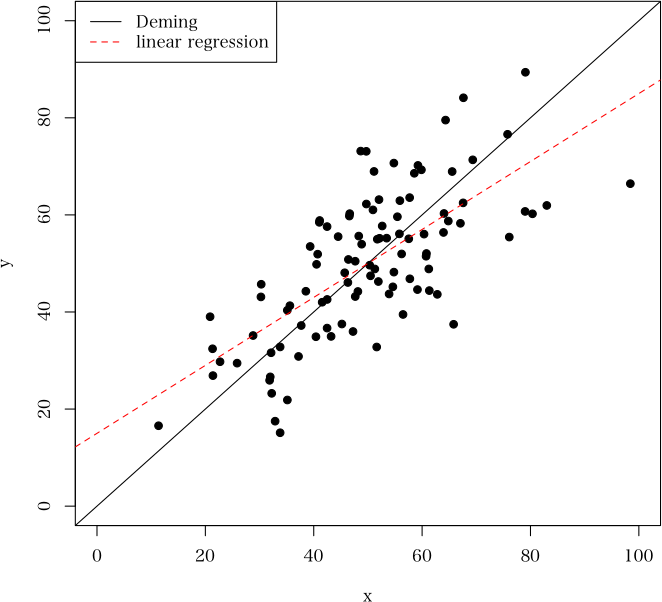
        else {                                                          # 散布図と Deming 法の回帰直線と直線回帰式を表示する
                plot(obj$x, obj$y, xlab=xlab, ylab=ylab, ...)
                abline(obj$coefficients)
                abline(lm(obj$y~obj$x), lty=2, col=2)
                legend(posx, posy, legend=c("Deming", "linear regression"), lty=1:2, col=1:2)
        }
}


使用例

> set.seed(123)

> d <- gendat2(100, 0.7)*15+50

> (a <- Deming(d[,1], d[,2])) # 点推定値のみを求める

Intercept: 0     Slope: 1

> plot(a, xlab="x", ylab="y", pch=19, xlim=c(0,100),ylim=c(0,100)) # 散布図と回帰直線


> (b <- Deming(d[,1], d[,2], n=1000)) # 点推定値と信頼区間を求める

           Estimate    0.025%  0.975%
Intercept:        0 -11.66837 10.4718
Slope:            1   0.78298  1.2427

> plot(b, hist=TRUE) # ブートストラップパラメータの分布図

 直前のページへ戻る
  E-mail to Shigenobu AOKI

 > (b <- Deming(d[,1], d[,2], n=1000)) # 点推定値と信頼区間を求める
Estimate 0.025% 0.975%
Intercept: 0 -11.66837 10.4718
Slope: 1 0.78298 1.2427
> plot(b, hist=TRUE) # ブートストラップパラメータの分布図

 > (b <- Deming(d[,1], d[,2], n=1000)) # 点推定値と信頼区間を求める
Estimate 0.025% 0.975%
Intercept: 0 -11.66837 10.4718
Slope: 1 0.78298 1.2427
> plot(b, hist=TRUE) # ブートストラップパラメータの分布図
