星座グラフ Last modified: Aug 24, 2004
目的
星座グラフを描く
使用法
Constellation.graph(dat, w=NULL, points=100, ...)
引数
dat 多変量データ(データフレームでも行列でもよい)
w 変数ごとの重みベクトル(標準値は,全部等しく,1/m ただし,m は変数の数)。
points 半円をなめらかに描くための点の数(標準値は 100)。
... plot, points に渡す引数。
ソース
インストールは,以下の 1 行をコピーし,R コンソールにペーストする
source("http://aoki2.si.gunma-u.ac.jp/R/src/Constellation.R", encoding="euc-jp")
# 星座グラフを描く
Constellation.graph <- function(
dat, # 多変量データ
w=NULL, # 変数ごとの重みベクトル
points=100, # 半円をなめらかに描くための点の数
...) # plot, point に渡す引数
{
dat <- t(as.matrix(subset(dat, complete.cases(dat)))) # データ行列は転置したものを使う
if (is.null(w)) { # 重みベクトルのデフォルトは,
n <- nrow(dat) # 変数の個数で,
w <- rep(1/n, n) # 1 を割った値(同じ値)
}
mx <- apply(dat, 1, max) # 変数ごとの最大値
mn <- apply(dat, 1, min) # 変数ごとの最小値
rg <- mx-mn # 変数ごとの範囲
dat <- pi*(dat-mn)/rg # 円内に収まるように正規化
y <- colSums(sin(dat)*w) # x 座標
x <- colSums(cos(dat)*w) # y 座標
plot(c(-1, 1), c(0, 1), type="n", # 描画枠を決める
xaxt="n", xlab=" ", yaxt="n", ylab="", asp=1, ...)
points(x, y, ...) # 点を打つ
axis(1, at=-1:1, lab=-1:1, pos=0) # 横軸
axis(2, at=0:1, lab=0:1) # 縦軸
theta <- seq(0, pi, length=points) # 半円を描く準備
lines(c(0, cos(theta), 0, 0), c(0, sin(theta), 0, 1)) # 半円を描く
}
使用例
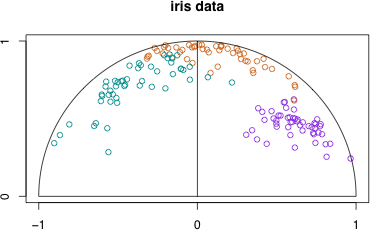
data(iris) # Fisher の iris data を図示してみる
col <- c("blueviolet", "chocolate3", "darkcyan")[as.integer(iris$Species)] # setosa, versicolor, virginica をそれぞれ,紫,茶,緑系の色で表示する
Constellation.graph(iris[1:4], col=col, main="iris data")
出力結果例
 参考文献
脇本和昌,後藤昌司,松原義弘著「多変量グラフ解析法」,朝倉書店,76〜84ページ
脇本和昌,垂水共之,田中豊編「パソコン統計解析ハンドブック I 基礎統計編」,共立出版株式会社,244〜255ページ
河口至商,水田正弘「パソコンによる多変量グラフ解析入門」,森北出版株式会社,80〜83ページ
参考文献
脇本和昌,後藤昌司,松原義弘著「多変量グラフ解析法」,朝倉書店,76〜84ページ
脇本和昌,垂水共之,田中豊編「パソコン統計解析ハンドブック I 基礎統計編」,共立出版株式会社,244〜255ページ
河口至商,水田正弘「パソコンによる多変量グラフ解析入門」,森北出版株式会社,80〜83ページ
直前のページへ戻る E-mail to Shigenobu AOKI
